@Slideup overall I thought the result was OK - neither particularly good nor bad.
Before providing some further detail, at the time of writing, the share price movement has been due to only 26 trades for a total value of $47k. Because of this, I tend to ignore the "market" reaction. Its pretty much irrelevant when you think that the average trade is only around $2k.
I've put some of the usual trend charts in, because I only ever look at quarterly data in the context of a longer time series.
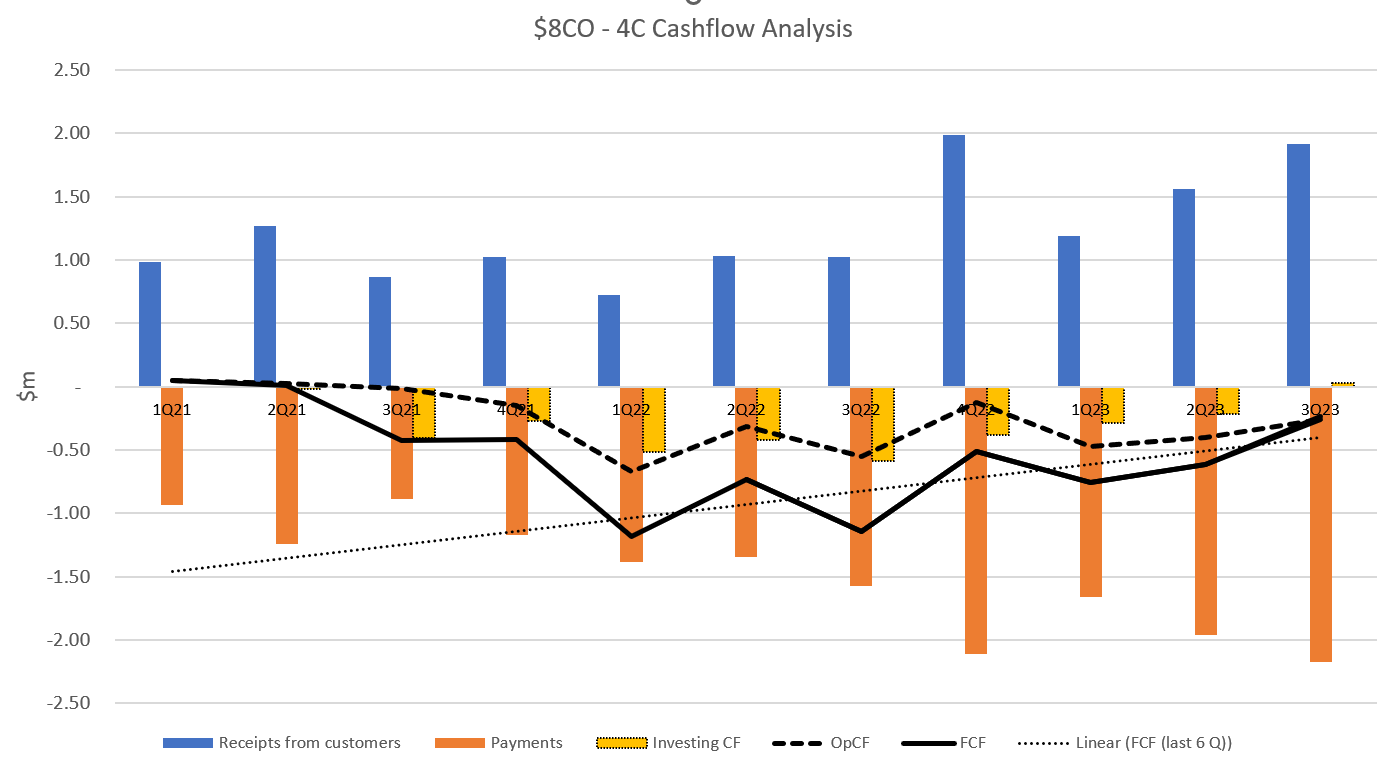
In Figure 1, I have plotted the trend line for FCF over the last 6 Q. It is looking quite good and, if they stay on trend, then it looks increasingly likely they'll make it through to positive cash generation in the coming year - which has been a consistent message. This is in spite of the additional cyber security and parnter costs pointed out by @Scott. (I guess there is nothing like the kitty running low in the current environment to focus your mind!)
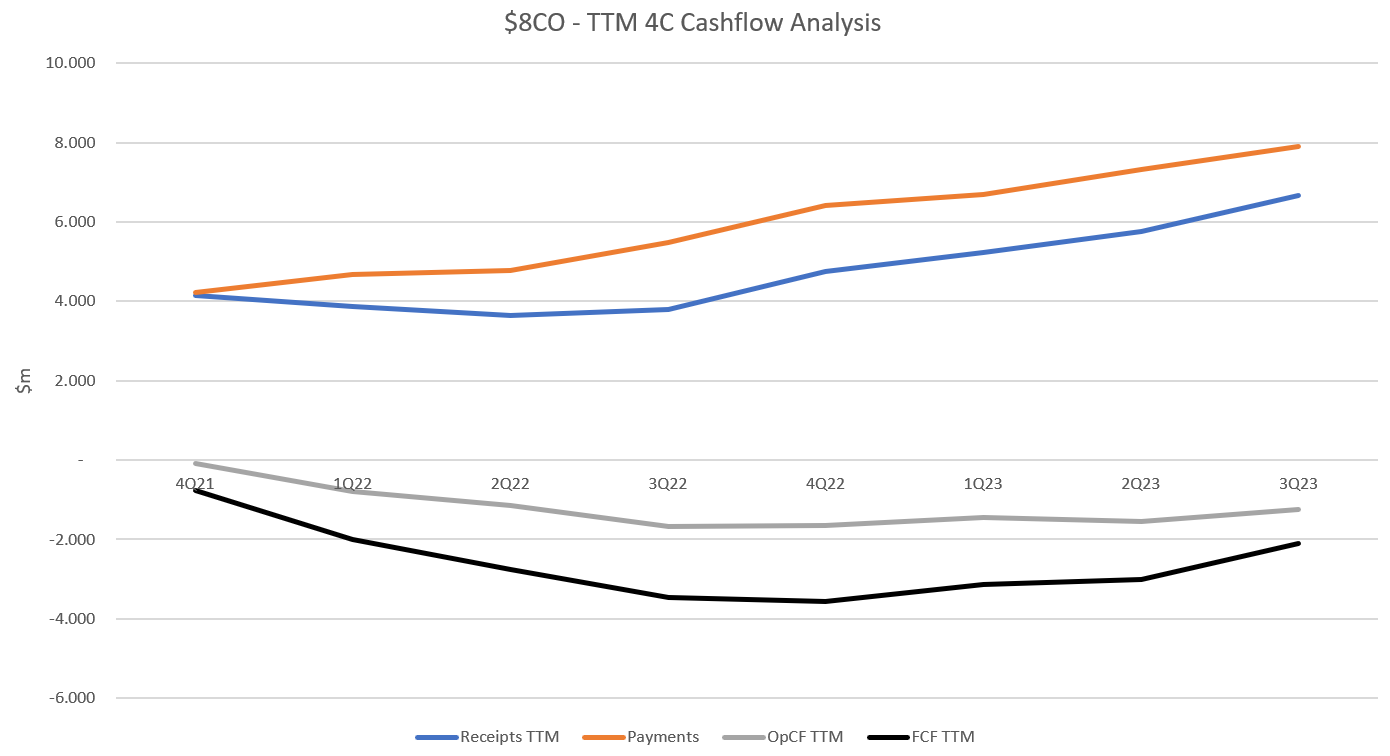
In Figure 2 I've plotted the trailing 12 month (TTM) trend for cash flows. This shows more clearly the trend of FCF turning the corner over the last two years.
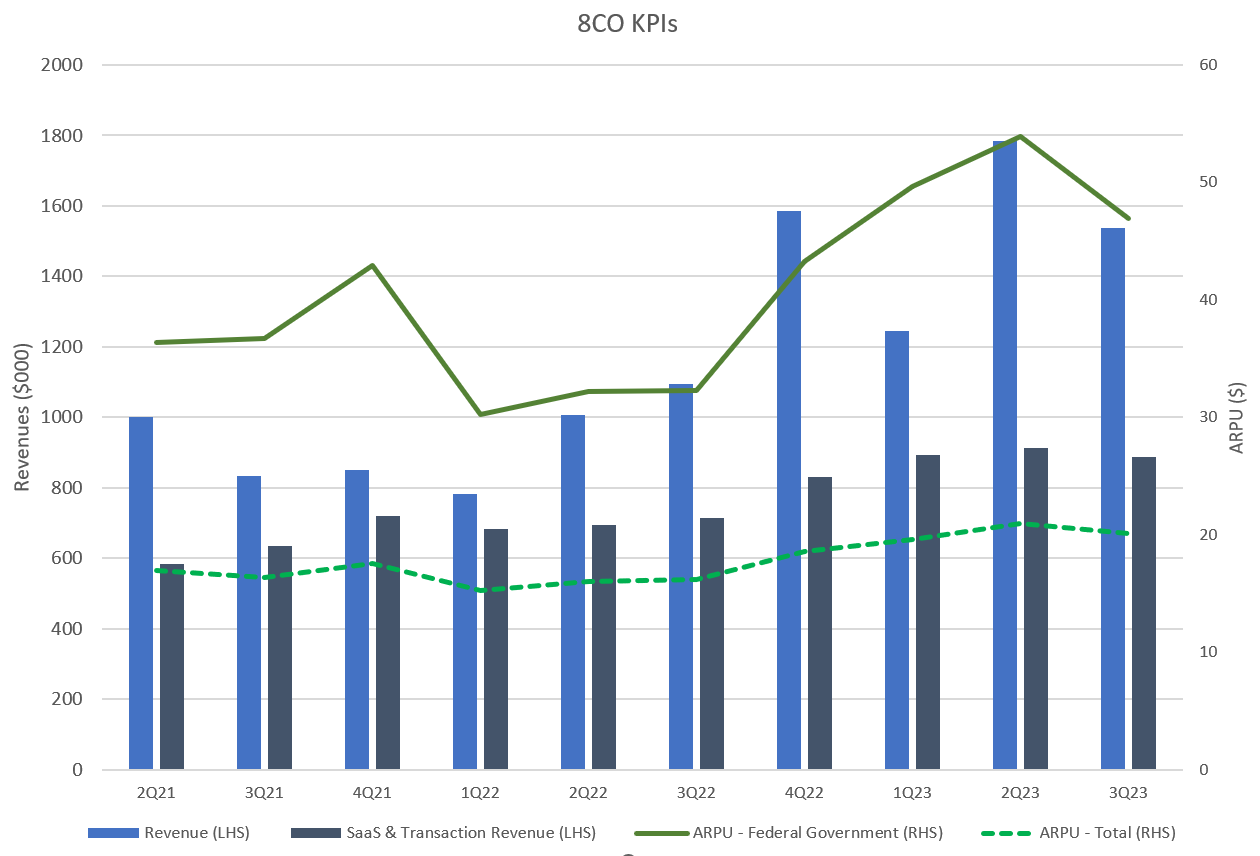
I guess the motivation for selling today came from the KPI charts which I plot in Figure 3 and 4. Again, I think it is helpful to look at the quarter in the context of many quarters.
Both revenues and ARPUs are lumpy from Q to Q. This implies to me that they are strictly reporting the numbers from revenues in the quarter. @Slideup it doesn't make sense to me that these numbers could be TTM figures, as the quarterly variations are just too wild. But good idea to clarify on the call on Monday. (see you there!)
Who know if their observation about Jan-Mar quarter is correct. It sure makes sense at one level from everyday experience, but it isn't a consistent story across their reported history. Eye-balling the numbers it does look like 3Q might have been part of a slowing trend, even trying to approximate a seasonal correction when looking at Q3 FY21 and Q3 FY22 in the context of their respective 2Q and 4Q results. To me, it all looks to be in the noise.
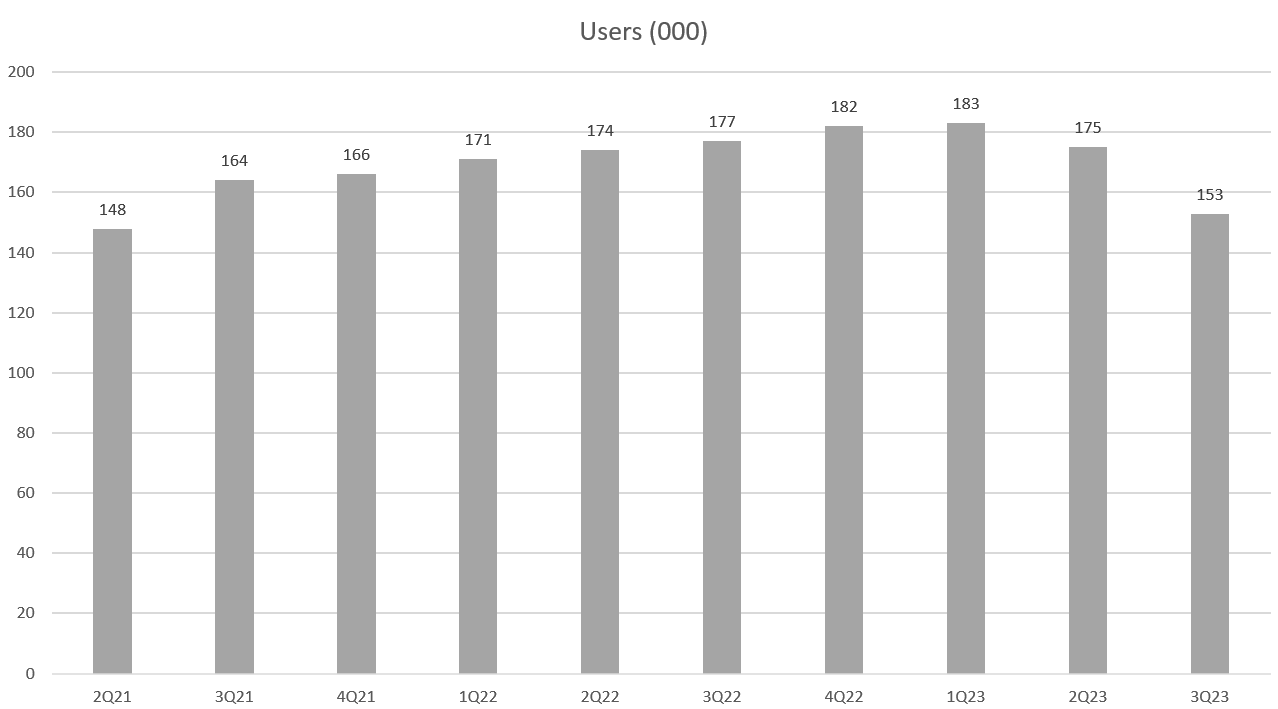
Finally, there is the reported number of users. Last time we saw them de-book a bunch of users for cards that weren't active. Now its a reduction due to non-renewal of a contract. Even though it is not a material contract, a defecting customer should always be a concern. So I hope their is some explanation of this on Monday - Why didn't the customer renew? Which product did they migrate to? Why?
Tracking users is great, but I suspect they have been the victim of this being a tricky metric to track as it ultimately depends on how many cards their customers issue to staff. Perhaps it would be better if they stuck to a more meaningful measure like number of active users, where an active user is a card that has incurred expenditure in the last 12 months. Personally, I am not overly concerned about the users KPI provided they keep adding large government departments, with ARPU and total revenue heading in the right direction. Clearly, number of users needs to trend back up and soon!
On the meagre CardHero additions, I'm also not too worried at the moment. $8CO are running on the smell of an oily rag at the moment, and with a need to control costs they are clearly focusing on the GovERP initiative. That makes senseto me.
So overall, it is a mixed bag. Not enough today to make me change my tiny holding. Having said that, 4Q might end up looking comparatively strong so before we get there I'll take a view as to how the rest of my small cap / very high risk holdings are tracking, and might up the weight opportunistically. (Need to mull this over a bit)
Disc: Held IRL and SM
Figure 1

Figure 2

Figure 3

Figure 4


