Tuesday 13th Jan 2026: Onwards and Upwards:
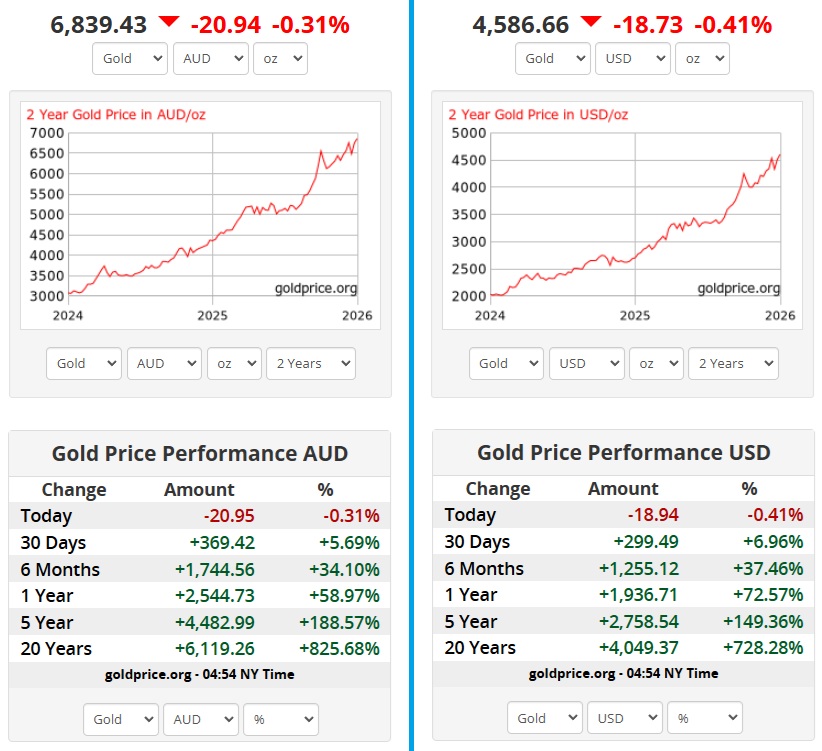
AU$ gold on left, US$ gold on right. [Two Year Gold Price Charts]
So the gold price is forging ahead, onwards and upwards, and apart from the continuing central bank buying as countries like China reduce their US dollar reserves and increase their gold reserves, we've got DJT, the POTUS (a.k.a. the President of Venezuela), doing crazy sh!t and stirring up further uncertainty, example: Iran 'prepared for war' | NATO and Greenland defence push [SBS News, 4 hours ago]
Bad for the world, but good for gold. So what I have I been doing, since I was already VERY overweight gold going into calendar 2026?
I've been increasing my exposure to a select group of gold project developers and emerging / new gold producers while trimming my larger gold company positions a little.
Based on prompts from right here in a forum (this forum) (Highest Conviction Stocks / Shares / Companies going into 2026), I asked a friend who is not a Strawman.com member three questions. Here are my own answers to those same three questions:
What companies are your highest conviction companies for 2026 (1 to 3 companies, any order, and why) ?
Shortlist is LYL, GNG & GMD. With RMS and NST nipping at their heels. EVN isn't too far behind either. Reasons - management track record, industry position, tailwinds.
What companies or positions are you most excited by in 2026?
Of my goldies, BC8 and CYL because IF they execute on their promise and exceed the market's expectations, there will be material upside. Outside of gold, ... well, not much really. I'm bullish on a few names but not exactly truly excited except in the gold space. Meeka (MEK) does excite me because they just keep going from strength to strength and I reckon there's M&A in their future, but I don't know if they get acquired or they themselves do the acquiring. So I reckon I'm excited by the emerging gold producers more than the well-established ones in early 2026. They are definitely higher up the risk curve, but they have more potential upside if they can execute well.
What company do you hold that you consider to be the most undervalued company right now?
ARB Corporation is 30% undervalued IMO just based on the Trump's tariffs discount - which has taken ARB from circa $40 down to circa $30/share, so a 25% discount in the price) compared to where I reckon they would be trading without that concern about their US "rollout" - which would be in the $40s. But ARB is a high quality company - like Resmed, MAQ, etc., and there is usually a quality / management premium in the share price. We're seeing that in the gold sector with GMD's current market valuation. I think it's well deserved and Genesis will grow into that valuation but there would be other punters who think there is already too much future upside already priced in with Genesis and therefore there's way too much downside risk at these levels and so they wouldn't be buying them at circa $7.50/share.
That situation is similar, usually, at ARB, except now around 25% of that premium in their share price has come out - but not based on their results, just based on the perceived risks of an element of their growth strategy. So ARB are looking more fully priced and less "overpriced with a big quality / management premium in their SP" (as they usually tend to be priced), so my thoughts are that they have been going for 50 years with the same management (Andrew and Roger Brown took over early on from the company's founder, their brother Anthony [Tony] Ronald Brown, a.k.a. A.R.B.) and they have always found ways to grow and create value, and that will continue IMO.
A potential 30 to 33% SP rise from "fair value" back to "priced with a premium" (low $30s/share to somewhere in the $40s/share) may not seem like a massive value opportunity, but value is hard to find in the market these days. So, on Friday I bought more ARB and they're now my largest SMSF position, with BC8 at #2.
The big advantage of ARB is their quality, so even if I'm wrong about what I've just outlined, I'll still own a decent position in a quality company who will be worth more in 5 years, and even more in 10 years, so it's a low risk play, IMO.
Note: To be clear, ARB aren't technically 30% undervalued, it's more they would be trading around +30% higher (IMO) if there wasn't this tariff concern over their US stores. As I've explained. It's not value so much as relative value, so value compared to where they would normally trade, i.e. with that management / quality premium in their SP.
Also, they're not trying to roll out stores "across the USA" exactly, they have taken a 50% stake in an existing 4WD company (ORW), then bought another chain (4WP) out of Chapter 11 bankruptcy and they have actually closed 5 of those stores (explained on the left of the following slide from their AGM presentation), but I'm expecting ARB to (1) grow that store network further over time and (2) to buy the remaining 50% to become 100% owners of 4WP/ORW:
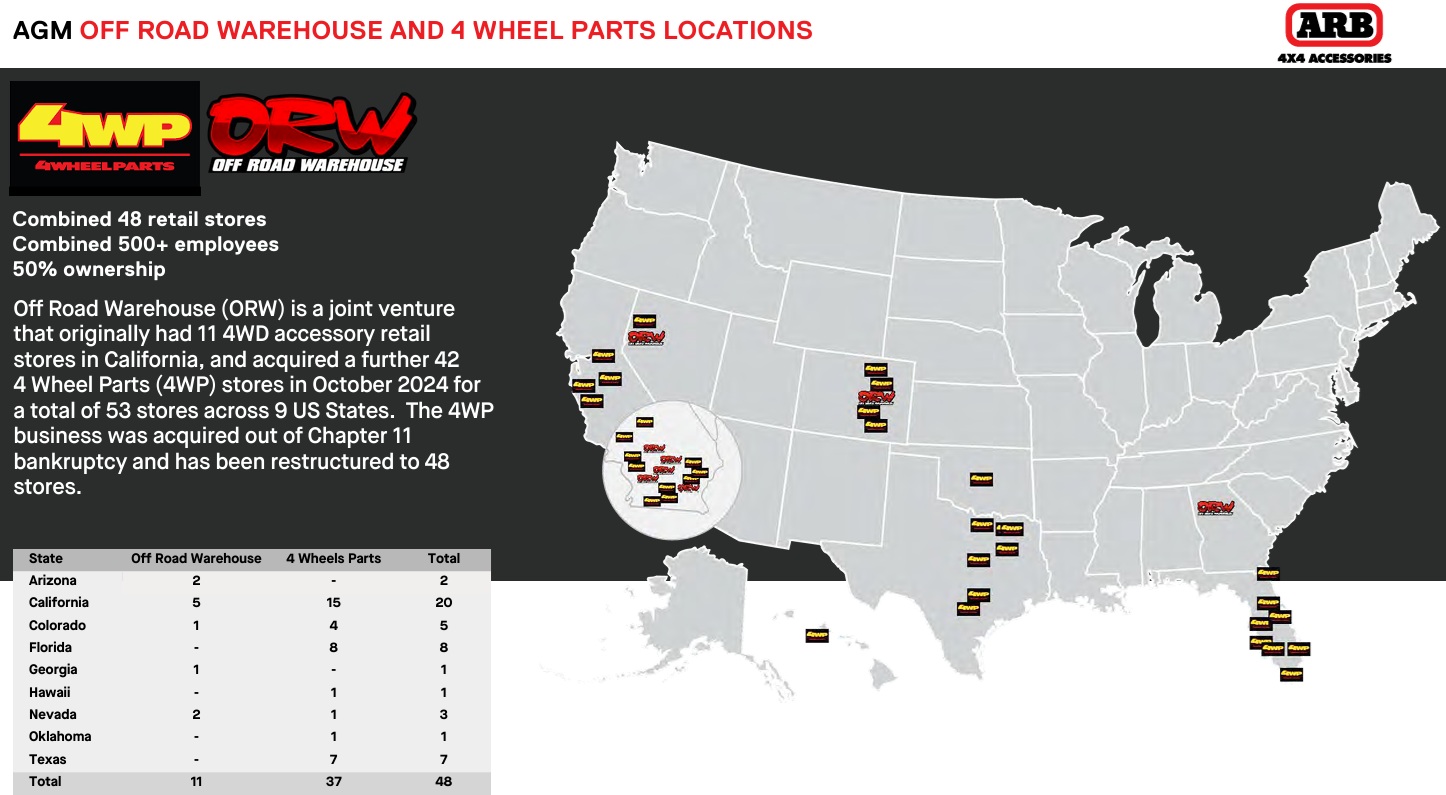
They are being selective on where they operate, mostly in US' southern states, as shown above, with a heavy presence in California and Florida, then Texas and Colorado in central southern US. It's measured and focused on core demographics - stores where the most buyers are - and they're progressing this in a very measured way same as they did while rolling out ARB stores across Australia back in the day.
So there is clearly a perception that US tariffs could negatively affect or even derail their US store "roll-out", because ARB mostly manufacture their products in Melbourne and in Thailand, and those products are imported into the USA, and they also import some products from China into their warehouses globally, including the USA.
I personally don't believe it's a significant issue, but I reckon it is a factor contributing to the recent ARB share price downtrend. But this is a management team I'm willing to back.
As well as topping up my ARB or Friday (@ $30.97), I had a buy (top up) order in for more CYL (Catalyst) @ $7.07 sitting in the market since last week, and then yesterday at 3:21pm (Sydney time), CYL dipped down and the market took out my buy order (@ $7.07) before CYL closed at $7.18, their lowest close since December 18th. They closed at $7.36 today (up +2.51%).
In my SPF (speccy portfolio) I've fully exited (sold out of) SHN and BLG yesterday, taking advantage of their respective SP bounces on positive announcements. Both were at a profit for me but nothing massive, in fact BLG was only a $5 K position that I sold for $5,440, so a small $440 profit for a few months, but I had decided to reduce the number of positions in that SPF and increase weightings to some of the remaining ones, and my lowest conviction positions were SHN and BLG. In fact I reckon BLG (that's Bluglass not Bellevue, i.e. BLG not BGL) is severely undercapitalised and they just don't have enough of a technical edge in GAN lasers to warrant serious interest from a potential acquirer - but then I'm no laser expert so they'll probably double or get taken out at a fat premium now that I've said that (and have sold out).
I increased my AZY position on the 6th (Jan) and I've had a buy order in for KAL for another 200,000 shares, to double my position, priced at $0.048, and 127,596 got bought yesterday leaving 72,404 still in the market (at 4.8 cps) at the top of the queue at that price. I'm being opportunistic with these buys and sells now, so I'm not phased if they do NOT go through, but if they do I figure I'm probably making some money.
AZY and KAL are not high conviction for me or even among my favourite companies in that SPF but like I've done with HRZ and GG8, I'm happy to buy more when they're sold down and then trim those positions when their SP rises up again. They're only one positive catalyst away from regaining previous highs IMO. AZY is going to be a slow burn in terms of them developing Minyari Dome, but they don't expect to have take it through to production (and I agree with them) and that's why they're clearly in no rush to spend those big bucks on building a plant any time soon. The play is to prove out the gold in their tenements and then get taken over by Greatland (GGP) who already have Telfer right there alongside Minyari Dome, Telfer being an underutilised plant and a very large capacity gold mill, one of the largest in WA. I don't know when that M&A happens, but's it's the only logical outcome for both companies IMO. [note: certainly not guaranteed, just very likely IMHO]
KAL have underperformed because the gold grades they have been reporting are rather underwhelming, however what they are trying to prove is that the gold extends considerable distance and they have said from the outset that they are looking to discover a large gold camp, so they are all about trying to ascertain whether all of their discoveries link up as one large deposit or else how many separate deposits do they have? It doesn't have to be high grade to be successful; Gruyere started off as a series of low to average grade discoveries and the average grade of ore mined at the Gruyere gold mine has typically ranged from approximately 1.0 g/t to 1.3 g/t gold. And Gold Road got bought out by their JV partners Gold Fields last year to get hold of 100% of Gruyere and the surrounding tenements. Gruyere's ore reserve grade, as reported in early 2025, was around 1.29 g/t (grams per tonne) Au, part of a total open-pit reserve of 83 million tonnes for 3.45 million ounces of gold, so quantity trumps quality in that case.
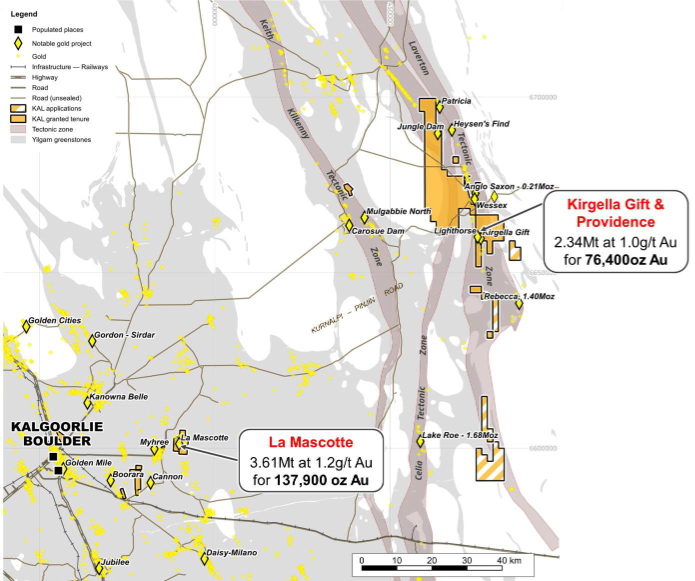
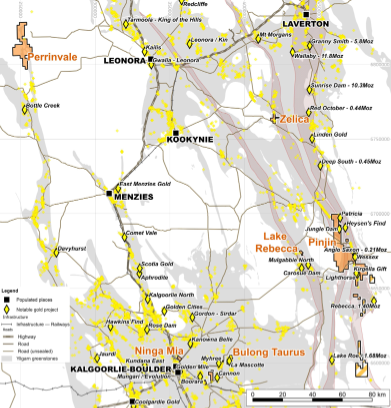
KAL are trying to prove up something similar in an underexplored area east and northeast of Kalgoorlie and southwest of Gruyere, and they even have applications in for tenements close to RMS' Rebecca and Roe deposits:
Zooming out:
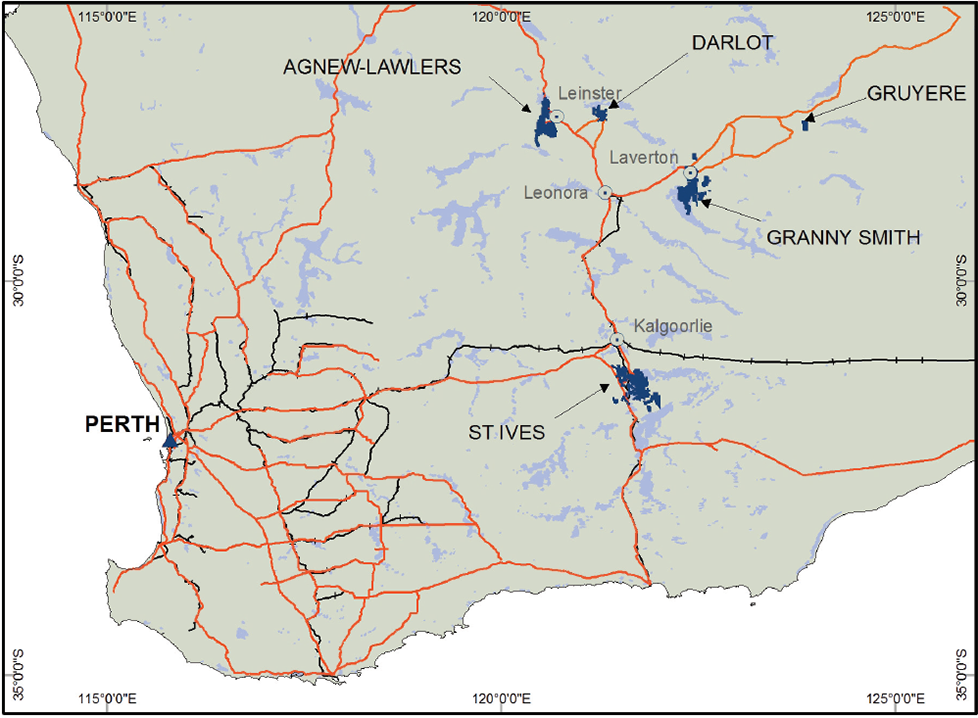
Gruyere is ENE (east-northeast) of Laverton:
Importantly, KAL is exploring down the Laverton Tectonic Zone (LTZ), part of the Eastern Goldfields Superterrane - a large crustal block or assemblage made up of several distinct, smaller terranes (geologically unique crustal fragments) that share a common, complex tectonic history, often forming a major component of a larger continental margin through accretion - and that LTZ is part of the Yilgarn Craton, and the LTZ hosts (to the north of KAL's tenements), Granny Smith, Wallaby, Sunrise Dam, Red October, Linden Gold and Deep South.
Additionally, KAL's Pinjin project is just to the east and northeast of Carosue Dam and Mulgabbie North, and they have RMS' Rebecca and Lake Roe deposits to the south.
Right alongside KAL's Pinjin gold project (on their eastern boundary), there is Heysen's Find, a newly discovered, high-grade gold prospect that forms part of OzAurum Resources' (OZMs) Patricia Gold Project, with recent sampling showing up to 16.23 g/t Au and extending over 250m.
That zoomed in map again:

Jungle Dam, Lighthorse and Wessex are owned by KAL. The Anglo Saxon gold project is a joint venture - 70% Hawthorn Resources, 30% Gel Resources - focused on high-grade gold, with past open pit mining and potential for underground extraction, utilizing a dedicated haul road to Carosue Dam operations and strategically located near Ramelius' Rebecca project, with ongoing studies to optimize development amid strong gold prices, involving partners like KalGold (KAL) exploring nearby prospects. Google sources: https://www.listcorp.com/asx/haw/hawthorn-resources/news/anglo-saxon-gold-drilling-results-3293598.html plus https://www.listcorp.com/asx/haw/hawthorn-resources/news/clarification-to-anglo-saxon-drilling-3225656.html plus https://hawthornresources.com/anglo-saxon-gold-mine-trousers-legs-joint-venture/
KalGold (KAL) have completed a farm-in agreement to secure a 75% interest in the tenements hosting the Kirgella Gift and Providence mineral resources within the broader Pinjin Gold Project area. The original vendors (a group of local prospectors) are free carried until a decision to mine is made, at which point KalGold has the potential to secure full ownership. Source: https://announcements.asx.com.au/asxpdf/20250529/pdf/06k6k8l9ykn1gl.pdf [29-May-2025].
So the major mover in the area (and major tenement owner) is KalGold (KAL) and there's also OZM and HAW operating on KAL's eastern boundary. HAW's SP has doubled since mid-October and OZM's SP has halved since April 2025. One is in a horrible downtrend (OZM) and the other is in a very strong uptrend (HAW) while KAL has been trading in a wide band between 3.6 cps and 8.3 cps over the past 11 months - let's call it 4c to 8c - and they're currently towards the bottom of the range (closed today @ 5.1 cps) and I've been buying them (topping up my existing position) at below 5 cps (4.8 cps yesterday).
High risk, but it wouldn't take much to see them back at the top of that range - at around 8 cps, and that's 57% above today's close and 67% above my 4.8 cps buy price yesterday.
Won't suit everyone, but it's my own personal form of gambling.
Not advice, just my own journey, opinions, good and bad decisions and perspective.
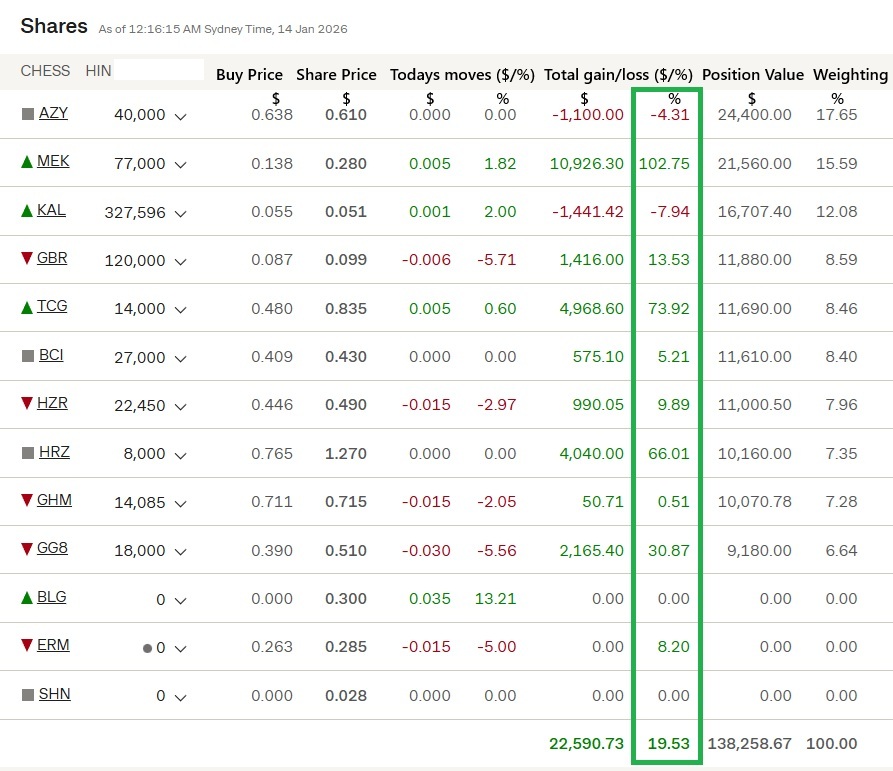
KAL is part of my Speccy portfolio (SPF) which I've put $150K into and I'm now trading. I've taken a fair bit out over the past 3 months - i.e. taken profits. Here's how it looks today:
Notes:
- I sold out of SHN and BLG on Monday (12th Jan 2026) as explained above, hence their $0 position now.
- I have a sell order in for ERM at a price higher than today's trading range. They are a company that Trav from MoM rates as most likely to get M&A attention in 2026 because of their royalty rights and the fact that they are free-carried on a number of their projects because of favourable farm-in agreements they have struck with their JV and farm-in partners. Smart operators, not having to spend much money plus they have money due to flow in to them this calendar year due to those aforementioned arrangements, however Emmerson (ERM) are a low conviction holding for me and I've decided to reduce the number of positions held in that SPF and invest more into the ones where I have a stronger investment thesis (IT).
- If I cancelled that ERM sell order the portfolio value would increase by $8,550 (30,000 ERM @ today's close of $0.285).
- I have already trimmed a number of these positions and used the proceeds elsewhere. Examples:

And
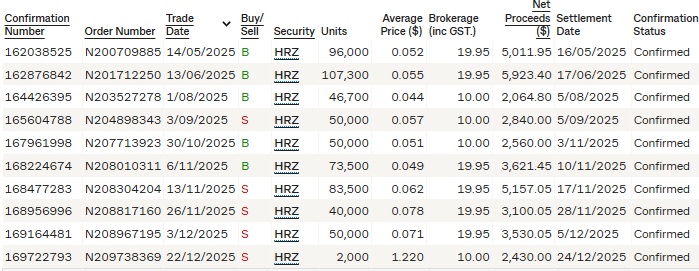
Note: HRZ did a 1 for 15 (1:15) share consolidation in mid-December between that 3-Dec-2025 sell @ 7.1 cps and that 22-Dec-2025 sell @ $1.22/share, so $1.22 would have been 8.1 cps pre-share-consolidation.
As you can see above (in the SPF screenshot), HRZ is now my 8th largest position in my Speccy portfolio (SPF) however that's because I have trimmed my HRZ position a number of times.
So, yeah, I'm getting active in the smaller players and the emerging producers while trimming the larger gold producer positions.
Here's my SMSF with holdings in order of weightings, from largest positions down to smallest, as of today's (Tuesday's) closing share prices:
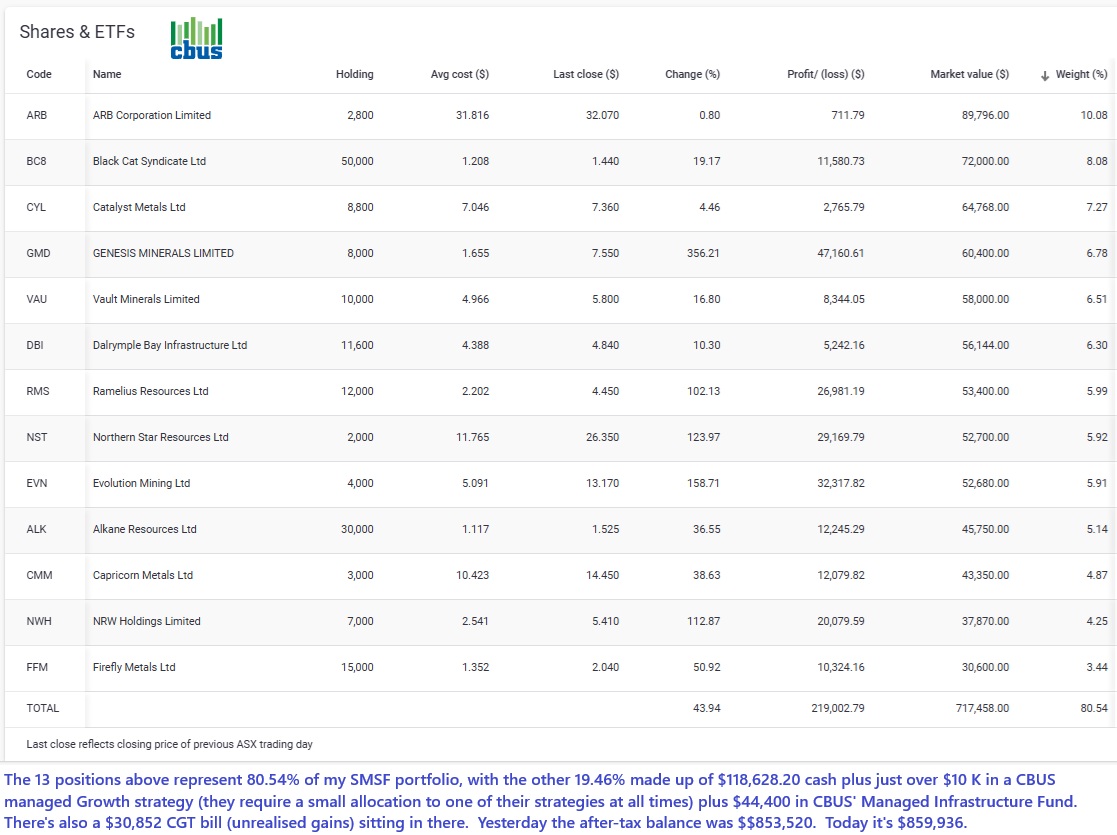
Note: I can only hold ASX300 companies in my CBUS SMSF.
Of the 13 positions in my SMSF, one is a copper/gold project developer (FFM), one is a mining services plus E&C contractor (NWH), one is a manufacturer, wholesaler and retailer of 4WD vehicle accessories globally (ARB), one manages a major Queensland coal export terminal and the associated infrastructure (DBI), and the other 9 are all gold producers, with a couple of those 9 also producing some copper as well; In EVN's case they do produce a LOT of copper as well as gold.
So, yeah, still heavily weighted to gold, plus some copper. And some antimony also in the case of ALK. But I have been taking profits. Some of those positions would be a LOT larger if I hadn't been skimming cream.
As you can see there, of the 9 gold producers I hold in that SMSF, Blackcat (BC8) and Catalyst (CYL) are now the largest gold producer positions in the portfolio, because I reckon they both have the highest potential upside IF they execute well and exceed the market's expectations over the next 18 to 24 months.
Not advice. Just my own thoughts and plans. And subject to change without notice.
I do intend to trim both positions (BC8 and CYL) as they rise.
And then there are the two other portfolios I manage, my income portfolio (IPF; holds just LYL and GNG) and my Kids' portfolio (holds just LYL), with LYL being my largest position across all of those portfolios and GNG being my second largest. ARB (held only in my SMSF) is now my third largest position.
So, yeah, gold is still going to rise from here, especially with the new President of Venezuela (and the USA) talking about bombing Iran again, taking over Greenland (the easy way or the hard way) and all the rest of it. Did somebody mention the Epstein Files? No, must have been my imagination. Back to these military moves on sovereign nations then.
Plenty going on, and I'm thinking that I'm probably still positioned well to do OK out of whatever happens with gold and the ASX in 2026.
Hope for the best while preparing for the worst.
My strategies are morphing constantly but gold remains a central theme.
Santa has come early as gold (and commodities in general) is making a go of it and potentially breaking out to new highs.

I found this presentation by Rick Rule struck a number of chords with me. He believes we are currently in a gold bull market.
I felt many of his insights were applicable to investing in mining companies, but companies more generally - Worth watching.
He espouses the idea that identifying and investing in quality individual stocks is the way to go.
He refers to Pareto's rule or the 80/20 rule and loosely applies it to the mining sector:
"In a subject as big as mining, 1% of the population base generates 40% of the utility in junior mining"
"The mining industry as a whole is valueless. Only about 10%of the issues are worth owning"
"You're Only Ever a Contrarian or a Victim"
All ideas that would not be foreign to @Bear77 whose work in this arena is without parallel around here.
Deutsche Goldmesse - Day 2- November 15, 2025- We were honoured to have Rick Rule, founder and CEO of Rule Investment Media, close out this year’s Deutsche Goldmesse. The legendary investor joined us to discuss the gold bull market and his framework for evaluating opportunities across the mining sector.
Sunday 30th November 2025:

I suggested here in recent weeks that I thought A$6,000/oz and US$4,000/oz might become new downside resistance levels from which the gold price would eventually take off again and resume its north-easterly trajectory. So far, so good.
The circa 9% "correction" to the gold price that we saw in October has been mostly made up for by the November rise, as shown above on those 1 Year Price Charts.
This is reflected by the GMD share price in their 3 month graph below:

And if we look at the two largest Australian gold companies, NST & EVN, they have both overtaken their previous highs that they set before the "correction" and are now making new all-time highs:


In NST's case their new all-time high of $27.92 was made during Thursday's trading (27th Nov) and with EVN their new $12.05 all-time high was reached during Friday (28th Nov) before they closed at $11.88.
And there was plenty of bullishness (positive sentiment) across the gold sector on Friday:
Here's my current Australian Gold Sector Watchlist showing Friday's trading and closing prices - from best performer on the day to worst:


I've highlighted the 4 physical gold (bullion) ETFs/ETPs in the orange/gold rectangles (above). The fact that they are near the bottom of the table with small rises and a small drop in the case of QAU (which is the only one that is currency hedged) shows how positive the sentiment was across the majority of the sector on Friday with most goldies rising a lot more than the gold price which rose a little.
WAF's finally back trading again after their 3-month suspension - I wrote a forum post about that here (today).
Mindax (MDX, near the bottom of that table above) is interesting in that it is the ONLY company in that list with zero bids ("Buyers") after the CSPA (closing single price auction) on Friday afternoon:

So clearly not ALL goldies are going to the moon. However, it should be noted that despite Mindax still owning their Mt Lucky Gold Project which lies within the Mt Margaret Mineral Field of the north-eastern Goldfields of WA (Laverton Greenstone Belt), approximately 7 km east of the producing Granny Smith gold mine (which is owned by Gold Fields Ltd, the recent acquirers of GOR - Gold Road Resources), Mindax is clearly prioritising their iron ore projects and assets at this point, so I should probably drop them off this list.
Interesting results at their recent AGM - This will obviously have happened before however I don't remember ever seeing this before myself - every one of their resolutions was passed with 100% of votes cast, with zero % of votes against - see here: MDX-Results-of-Meeting.PDF
They've either got some very happy shareholders, or... more likely they have a very tight register with bugger all retail investors who bother to vote.
They have 2,348,672,868 (2.35 billion or 2,349 million) shares on issue, and their three company Directors have some skin in the game:

Not too much in the way of "Subs":

Anyway, there's likely something going on there behind the scenes that might be uncovered with some digging, but I've got better things to do.
I do not hold MDX and aren't interested in owning them, but below is an overview of my current gold sector exposures:

Note: There may appear to be minor errors due to rounding but the spreadsheet itself (that this screenshot was taken from) has numbers that go to many more decimal places than those numbers shown above.
Column B shows each company's current share price (Friday's closing price), column C shows my weighted average cost per share, column D shows my current percentage gain or loss based on the difference between columns B & C, columns E and F both show my current weighting to that company as a percentage of the total value of all of my holdings in my three largest real money portfolios, and column G shows which portfolio each company is held in (of those three portfolios).
The difference between column E and column F is that column E is based on my total cost base, i.e. all the money I have invested in all of those companies, so it shows the percentage of my total cost base that I have invested in each company, whereas column F is instead based on the total of the current market value of all positions, so based on the total market value of all three portfolios combined based on Friday's closing share prices rather than what I paid for those shares.
This difference is clear if you look at a company like GMD where the share price is more than 300% higher than my average price paid for those shares, so it's a 1.51% position based on my cost base, but a 5.02% position based on the current market value.
It's less clear with the two Engineering and Construction (E&C) companies at the bottom where despite both share prices being higher than my average price paid for those shares, the market value % weighting (column F) is lower than the cost base % weighting (column E) which might seem odd, however it's because those positions have risen less in percentage terms than my overall gain across all portfolios based on current market prices, so the big winners like GMD, NST, EVN and MEK mean that in percentage terms LYL and GNG are underperformers in relative terms despite being worth more than what I paid for them, or to put it another way, LYL and GNG have performed OK, but not as well as many of my other positions - so far.
Hope that makes sense - I should also point out that my SMSF and Speccy portfolios contain other companies that are not listed above because those companies not listed above are not gold sector companies or E&C contractors who service the gold sector (like LYL and GNG) and this post is about the gold sector. So the numbers in columns E & F are based on the grand total of all of my real money share market positions, not just the ones listed in this post. So they are my true weightings based on either my total cost base (column E) or current market values (column F) of all of my real money positions in all three portfolios (PFs).
Most of the Producers are also actively exploring and developing other projects in addition to their producing mines, however in the case of VAU and EVN I am invested in them purely on the basis of their current producing assets so I have just listed them as "Producers".
All of the Developers are also Explorers, as they are all actively drilling or have planned drilling campaigns, and most of them are drilling at more than one project at the same time, however all of them do have at least one advanced project that they believe hosts enough gold to one day become a producing mine. It doesn't mean they are right, but it's what they are saying. I'm not going to stay invested in all of those developers until they become producers. In fact the Lassonde Curve suggests that during the FS stage a lot of these project developer companies should be expected to often have a falling share price in the absence of an external share price driver such as a rising gold price or positive M&A activity. So I'm in the explorers and developers for a good time, not necessarily a long time. I can and will sell or trim without notice. My view is that there is money moving up the risk curve (and down the quality curve) into the smaller end of the market now, due to the larger gold producers looking fully priced to some market participants.
None of this is advice, just what I'm doing at this point in time.
During the past week I have trimmed RMS, although they are still my second largest gold producer position, and added Vault Minerals (VAU) to my SMSF (I explained why here), and I have trimmed 4 of my Speccy positions to lock in some profits. I have also increased my LYL position by around +11% on Friday, taking advantage of the pullback below $13 (I topped up at $12.68). The Speccy PF trims funded the LYL top-up. So I'm fairly active with these portfolios, and they can change a fair bit from week to week.
BTW, the above table was done today, using Friday's closing prices, and reflects all of those trades that I just mentioned - so it's current as of today.
But my point is that I reckon the gold bull run is still intact, and I'm still on that ride.


