Saturday 6th June 2026:
Source: https://www.linkedin.com/in/sam-berridge-8150a02a/recent-activity/all/
The gold price continues to fall:
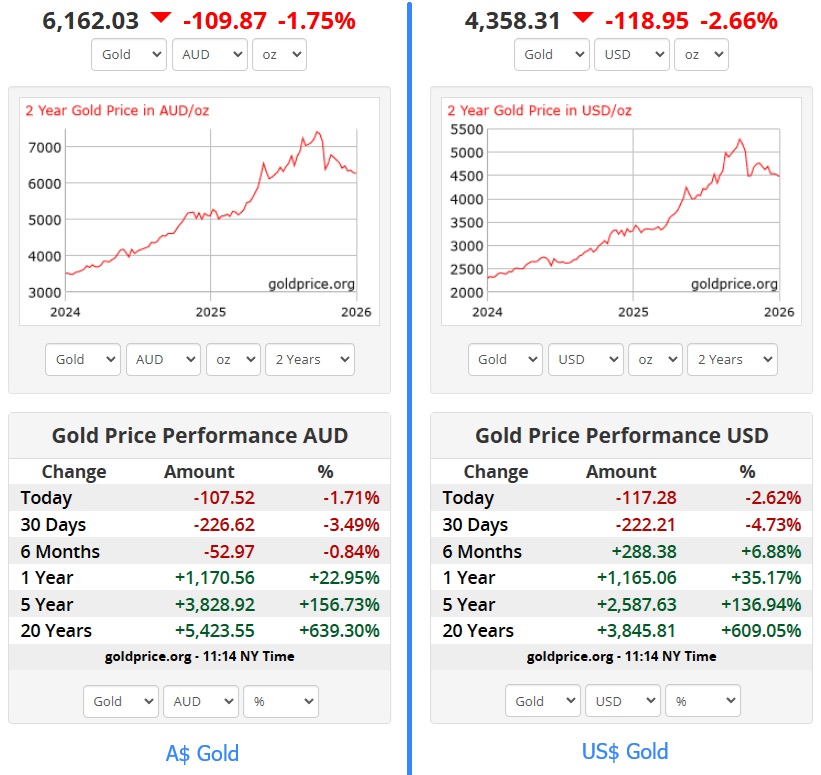
But these two year charts show the recent fall with some perspective.
Gold is still above A$6,000 per ounce and also still over US$4,000 per ounce.
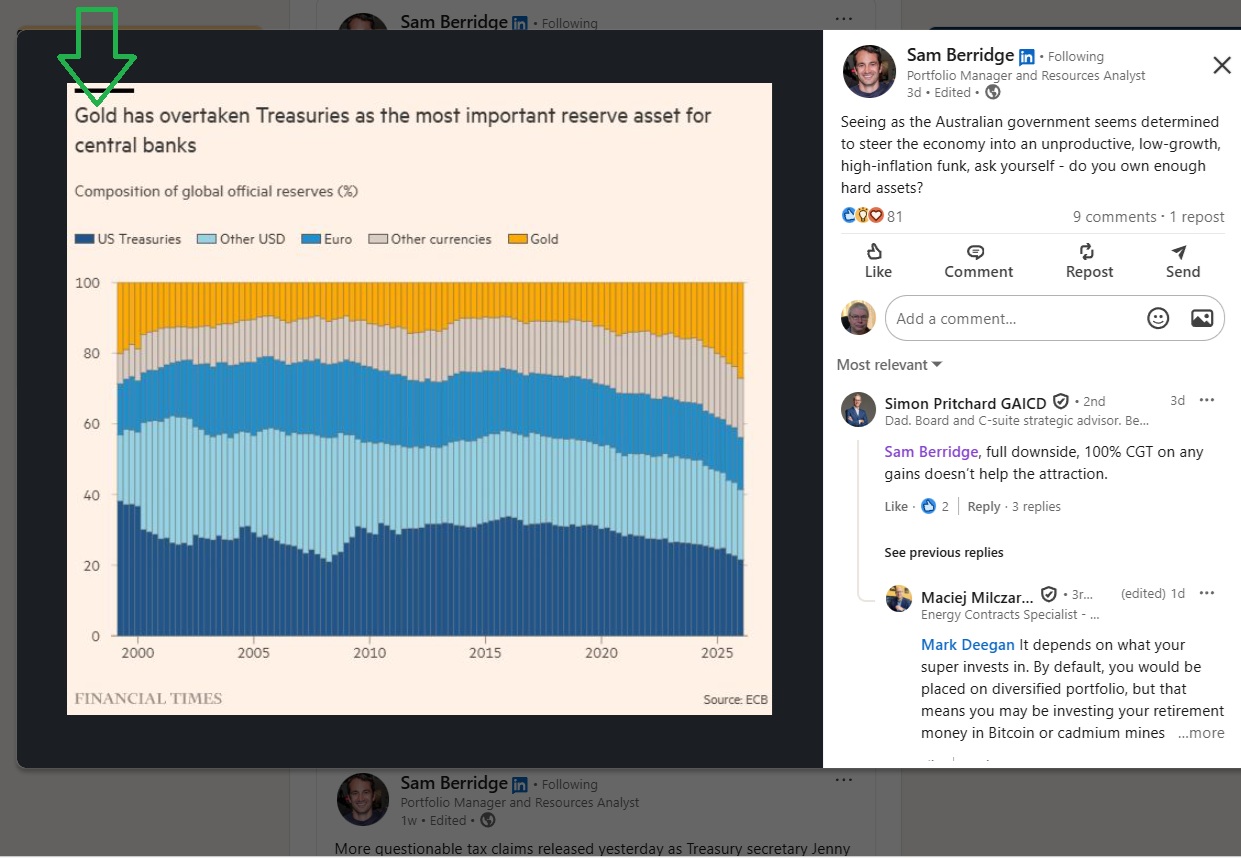
Gold remains very attractive, particuarly for central banks obviously, and the better gold producers are still making plenty in profits, and will still be very profitable even at significantly lower gold prices than where we are today.
My current sharemarket exposures are:
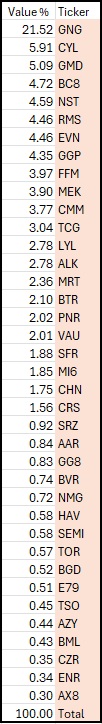
That list is from Thursday evening (4th June 2026) and those weightings are based on Thursday's closing share prices, so it's not based on sunk capital but on market value two days ago - I haven't updated the prices since then but the percentages wouldn't have moved much in one trading day. Those weightings are also of my combined real money portfolios, not what I hold here in my SM (virtual) portfolio / scorecard. And they do not include cash or other assets outside of shares. So each percentage just represents how much I have direct exposure to that company or ETF (are directly invested in them) as a percentage of all of my real money share market investments added together.
So I clearly like GNG a heap, I sold down my LYL position to free up money a few weeks ago just before their share price rose +$4/share in less than 2 weeks (real bad timing on my part), and my biggest direct exposures to gold producers are to CYL, GMD, BC8, NST, RMS, EVN (gold + copper), GGP, MEK, CMM and ALK, in that order. If you follow the gold sector you'll see a lot of other gold company ticker codes in that list which I also hold smaller positions in, plus some other smaller sector exposures (copper, tin, niobium, silver, base metals, palladium, semiconductors).
After engineering companies (GNG & LYL) and gold companies (most of that list above), my next largest sector exposure is currently to copper through two producers (SFR and EVN, with the latter producing gold and copper), a copper project developer (FFM) and an explorer (HAV) who now has two JVs with larger copper producers to potentially help develop two of their (HAV's) copper projects.
So yeah, I'm absolutely still a gold bull. And I'm becoming more bullish on copper.


19th May 2026: Just came across this: Australian Gold "Cash building & M&A is on but FY27 risks loom" by Levi Spry at UBS Research - 06/05/2026 07:41 pm AEST
Which contained this table:

Published on May 6th FWIW. I don't usually take much notice of UBS, but I do find it interesting that their price targets suggested that 2 weeks ago the 4 best companies to buy across the Aussie gold sector were Chalice (CHN), Pantoro (PNR), Catalyst (CYL) and Genesis (GMD) with their share prices needing to increase +108%, +91%, +89% and +72% respectively to hit their (UBS') 12 month price targets.
Interestingly I bought all four of those companies in my Income Stream Account (ISA) today, with CYL being my largest position there and GMD being my second largest. That would be a nice return if they could manage that sort of growth in 12 months and hit UBS' price targets.
Compared to the 6th May share prices listed above in column 3, CHN closed 1 cent higher today @ $1.45, CYL closed 31 cents higher @ $5.46, GMD closed 14 cents higher @ $6.04 while PNR closed 14 cents lower @ $3.11, so from today's $3.11 close for PNR ($3.11 also being the price I paid for them today) to UBS' 12-month Price Target of $6.20 for PNR, that would be a +99% share price rise. I'd take it if it happens.
My current ISA positions in order of weightings:

The remaining 16.64% of that portfolio is mainly cash, with some in CBUS' managed strategies.
And below are my current SPF (speculative company portfolio) positions and income portfolio (IPF) positions combined, from largest weighting to smallest:

The percentages relate to weightings for that portfolio only and do add up to 100%.
GNG, LYL & SEMI above are in my IPF and the others are my SPF, however I have them currently combined under the same HIN, so they display together. I have reduced my LYL exposure over the past 8 weeks, because I was seeing a lot more opportunities at the speccy (more speculative) end, so I rotated a fair bit of money into that. I also sold some to pay some bills while I was waiting for my ISA to be set up and for the first income payment from it to arrive - which was supposed to be back in March but ended up being last Thursday (14th May), so that took around two months longer than I had expected. I will be cycling some money back into LYL over the next few months to build the position back up.
Not all of those speccy companies are gold companies, but most are, there's also a tin play and a niobium play in there, and a silver play, and some have gold plus other metals or minerals in their portfolio of assets, or are exploring for more than just gold. Likewise, my ISA companies (which are all ASX300 companies, whereas the others immediately above in the SPF and IPF are all ex-300) also aren't ALL gold producers, there's two copper plays (SFR and FFM), another company produces gold and antimony (ALK), another has a high-grade antimony project in addition to their gold projects and gold production (BC8), and one has a high-grade tungsten project in addition to a lot of gold (GGP). But the majority of these companies are gold explorers, developers or producers, or a combination thereof.
So, yeah, I'm still bullish on gold.

As long as gold stays over A$6,000/ounce she'll be apples, and realistically it could fall to $5,000/oz or lower and all of my gold producers would still be making great margins. It's still a good time to be producing gold. Or looking for it and finding it. Or developing / progressing a gold project towards production and/or M&A.
Basically, it's still a good time to be in gold.
Friday 8th May 2026: I've been hearing recently that the gold price has been moving inversely to the oil price, so when the oil price drops, gold rises, and when the oil price rises, gold falls. Just recently - it doesn't seem to be that way over decent periods of time.
There has been a clear inverse relationship between the US$ and the gold price in prior years:

But that doesn't seem to apply to the oil price and gold over the past decade:

Source: https://www.macrotrends.net/1334/gold-prices-vs-oil-prices-historical-correlation
It's interesting that things might be changing in that regard.
The gold price has had a down month as oil prices have risen, but has risen over recent days while the oil price has been moderating or falling on the back of optimism about a possible "deal" between the USA and Iran that may lead to an end to the current conflict.

Source: https://goldprice.org/
New to strawman, so I am keen to sharing some comparative analysis for some of gold miners in my portfolio and on my watchlist. I have completed some research into explorers, but I don’t include it here as it can become dated extremely quickly.
The information in the table below is aggregated from analysis completed over the last 6-12 months and focus is on producers (or upcoming producers). The primary aim of the analysis was to assist in idea generation, with further deep diving before making decisions to reposition or reduce current holdings. I work in the industry, so I apply my own filters and nuances before making an investment (it's not just the numbers). However, I would love to hear other perspectives or thoughts on the information shared and I must admit I don’t know all of the companies well.
Finally, I have used AI to pull the information together into a single table, as I have looked at different metrics at different times in multiple spreadsheets. I have also used it to update recent information such as share prices and market caps in the process. I have critically reviewed the output, with specific checks for the companies of most interest and it is using a paid subscription which has been very at aggregating the information. All this to say let me know if you spot something that doesn't look right.
Output:
The table comprises of (in my preferred order of value):
1. Resource and reserves and Grade
2. Mining Method & Milling Head Grade
4. Simple DCFs price for each company (no residual value)- as a proxy for AISC & production profile
5. Average 12-month price target (added as a sanity check)
Process explanation:
The reserves and resource information is the oldest, however, I have updated this from time to time. I put this together on a “roughly right” basis, and you can find this information in a lot of company presentations. The table is my personal preference. I recently noted changes in Ora Banda numbers and there may be acquisitions that have not flowed through into the reserves (e.g. I am yet to confirm the if the Spartan acquisition is in the RMS reserves). There are others here doing a lot of drilling or work which could see additional material move into reserves. Therefore, a higher EV/reserves may indicate the market is pricing in reserves growth.
The mining method and milling head grade helps understand the key drivers for the business, potential risk and what I look at next. A couple of these are single asset head grades which are not that helpful for multi-asset companies. I find this useful for the smaller mines or those operating in a mill constrained or mining constrained environment. A mill constrained operation is expected to have higher grade feed whereby operations with milling capacity can still generate positive cashflow feeding lower grade stockpiles. There is a distinction with underground and open pit and the associated mining costs (more expensive for underground).
I run a basic 5-and 10-year DCF for each company using forward production guidance and AISC. I track these in their own workbooks for specific companies and have pulled together this number as a proxy for production profile, AISC and capex expenditure. I don’t use the final number as a company valuation or a price target; however, it is critical to note I have used the same gold price profile across all the companies (excluding those that hedge). In this case the “valuations” produced help understanding timing of cash flows and what risk profile each company has- e.g. is the value being generated by cashflows 5-10 years into the future. At the end of the 10-year DCF I subscribe zero residual value, therefore, this does not represent a valuation for a large company with significant ore reserves. NST for example is not representative.
The Table: A comparative output table to guide to what looks interesting. With nuance on what looks right and what carries risk... But I hope this helps.
Full disclosure I own RMS, GMD, BC8, KCN and NST. I have attempted to remain neutral on what I own and when I get time add the specific valuations in my strawman.
Outside of my current holdings I like CYL and VAU. RXL looks interesting but the refractory ore puts me off. I am put off by a few other things with cheaper looking companies such as management teams, jurisdictions or asset quality/complexity. But enough for now.
