Everyone loves a good stock chart. Up and to the right, all green candles and glory! But that is rarely how things play out in the real world, at least not over any meaningful time frame.
What the latest research from Michael Mauboussin and Dan Callahan makes painfully clear is this: if you are aiming for outsized returns, you will have to endure some truly awful stretches. Not just a rough quarter. We are talking full-blown, portfolio-gutting drawdowns.
The headline stat, which is rather stark, is this: between 1985 and 2024, the median drawdown for U.S. stocks was 85 percent.
Eighty-five!
In other words, most stocks, at some point, lost nearly everything. And this isn’t some tail-risk oddity. This is the middle of the bell curve.
Even more surprising is the fact that even the winners bled big time, albeit temporarily, on their way to greatness. For example, Amazon (NASDAQ:AMZN) dropped 95% in the dot-com bust. Around the same time, NVIDIA (NASDAQ:NVDA) fell 90% in just 9 months.
Again, these aren’t outliers. If you take the top 2% of all U.S. stocks, the ones that are responsible for a whopping 90% of all value created by the market since 1926, you get an average max drawdown of 80%.
It shows, yet again, that picking the right stocks is only half the battle. And, perhaps, the easier part. The real test is having the ability to endure through these inevitable, ego-crushing drawdowns.
Of course, while big drawdowns are never easy, the subsequent recoveries can be glorious. “Can” being the operative word here: only 46% of stocks ever claw their way back to their former peaks. But those that do are king-makers.
For example, as highlighted in the research, stocks that dropped 80–85% and survived saw a median return of 131% in the first year after bottoming. In the subsequent decade these same stocks delivered a 26% compound annual growth rate. That’s a more than 10x return over the period.
A word of caution, though: survivorship bias is doing a lot of heavy lifting here. This study excludes stocks that went to zero, and the market serves up plenty of those over time. So the message here isn’t to rush out and buy up any and all beaten up stocks.
Flesh wounds heal. Fatal wounds don’t.
Which begs the question: how do you tell the difference? The report offers two areas of focus.
First, ask: is the pain cyclical or secular? NVIDIA’s 90% plunge was part of a cyclical downturn, the result of a temporary oversupply of semiconductors. The Dexter Shoe Company, on the other hand, suffered from a structural reordering of manufacturing (i.e. cheap shoes from Asia), and it never recovered.
It’s not always easy to tell the difference between cyclical setbacks and structural decline (even Buffett himself misread Dexter’s problems and paid dearly) but making that distinction is crucial.
Second, you also want to check the basics: is the business model intact? Are customer unit economics sound? Is the company financially solvent and liquid? If it’s burning cash, can it raise more?
Of course, you can still check all these boxes and still bomb out. But they will certainly help you avoid a lot of pain.
Still, the key thrust of this research is that pain is not only unavoidable, it’s necessary for superior returns. And that’s a truth many Strawman members understand intimately; the price of great returns is stomach-churning volatility.
Wes Gray, a U.S. fund manager referenced in the research, once made a striking observation in a piece titled “Even God Would Get Fired as an Active Investor.” He noted that even with perfect foresight — buying the 50 stocks that would go on to deliver the best returns over the next five years — you’d (obviously) crush the index. But the ride wouldn’t be smooth: the divine portfolio still endured some brutal drawdowns, including a 76% plunge at one point during the backtest.
This is the central tension of active investing: the best-performing assets often come with the worst stretches of performance. And in a world where most managers are judged quarterly, not generationally, it’s no wonder so few beat the market.
The bottom line here is that this research doesn’t hand you a playbook for timing bottoms. That’s impossible. But it does shine a light on a harsh reality: you don’t get the gain without some pain.
If you can stay in the game, distinguish between short-term setbacks and terminal decline, and spot underlying fundamental strength, you’ll start to see drawdowns not just as the price of admission but as opportunities to be exploited.
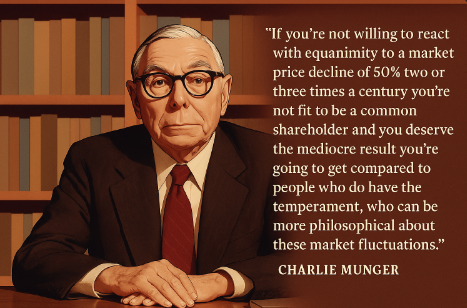
And remember, as Munger famously said…
Strawman is Australia’s premier online investment club.
Members share research & recommendations on ASX-listed stocks by managing Virtual Portfolios and building Company Reports. By ranking content according to performance and community endorsement, Strawman provides accountable and peer-reviewed investment insights.
Disclaimer– Strawman is not a broker and you cannot purchase shares through the platform. All trades on Strawman use play money and are intended only as a tool to gain experience and have fun. No content on Strawman should be considered an inducement to buy or sell real world financial securities, and you should seek professional advice before making any investment decisions.
© 2025 Strawman Pty Ltd. All rights reserved.