Monday 12-June-2023: Further to the excellent forum post by @Rapstar two weeks ago, I noted this from Marcus Padley's (MarcusToday) Saturday email over this past weekend:
Excerpts:
AUSTRALIAN UNDERPERFORMANCE
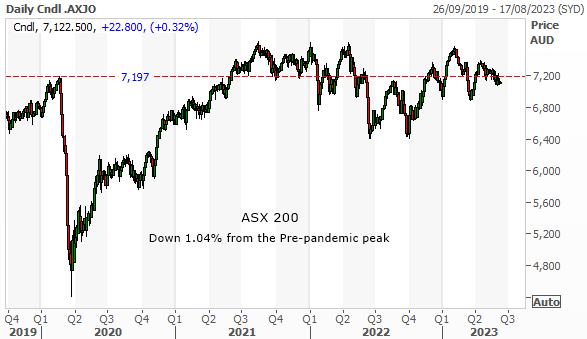
[i.e. ASX now back to 2019 peak]
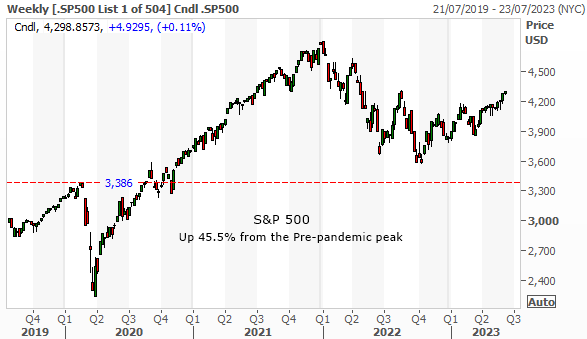
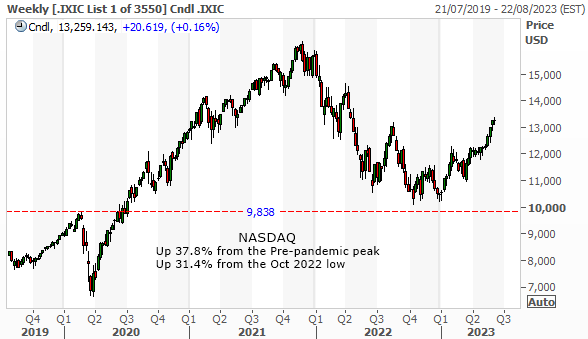
The S&P 500 hit a new 52-week high on Friday, a 13-month high in fact. The main driver overnight was the hope that the FOMC will “skip” a rate rise next week (FOMC meeting at 2am on Thursday morning). Just ahead of that there is a US CPI number with Core CPI expected to be +5.3% YY and +0.4% MM which compares to +5.5% and +0.4%. Headline number is expected to be +4.1% and +0.2% which compares to +4.9% and +0.4%.
--- end of excerpts ---
As many have observed, most of the rise in the US market has been on the back of their Information Technology sector (often abbreviated to either "IT" or just "Tech"), which is up a whopping +33.17% this year - and on a PE of 31.76x. The PE of the S&P 500 is now 22.7x.
The NASDAQ had one bad day during the past week where it looked to Marcus P like the Big Tech rally may have ended. Then it went up again.
I think it's important to note the big difference in performance between the US and the Aussie sharemarkets. While we're back to peak (pre-pandemic) 2019 levels, the US market is well above their pre-pandemic highs, and making new highs.
And we all know that the US market is Tech-Heavy, and it's that massive Tech sector that's been doing the heavy lifting for them. Our own market is instead dominated by Financials and Mining Stocks, and I won't even try to comment on the direction of our financial sector - I have very little exposure to it personally - and I don't usually see it as the best place to get the best returns for my investment dollars; But the mining sector could be the sector that drags us up in the near-to-mid-term.
We have three of the world's four largest producers of iron ore based here in Australia with their primary listings here on the ASX: BHP, RIO and FMG. Brazil's Vale is the fourth.
Iron ore is having a minor resurrection, up +6.27% last week and up +8.4% from the bottom - seemingly on hopes of Chinese economic stimulus after weak PMI numbers and export and import numbers. On the back of that, we saw a 3.4% rise in BHP last week and a 4.02% rise in RIO.
Chinese economic stimulus is of course what got us through the GFC without a recession. Barely a scratch really. I'm not convinced we're likely to see anything on that scale ever again, certainly not in the near-term, because you can only do that sort of thing - build airports and rail lines and cities where they are not yet needed - once really, - or maybe once every forty or fifty years? Certainly not this soon after doing it the first time.
So while economic stimulus in China is always on the cards, the extent to which it will help Australia is likely to be less than it was back during the GFC because the stimulus itself is very likely to be a lot less, and will result in a lot less extra steel (iron ore, met coal) and other metals being required.
If we look at the iron ore price graph, the price is reasonably volatile, but looks to be in a downtrend since those over-US$200/tonne levels in 2021. Since that 2021 peak we are seeing lower lows and lower highs, which is bearish, and I'm not sure that last week's price movement (highlighted below in red) is any sort of a break-out or change in that trend.
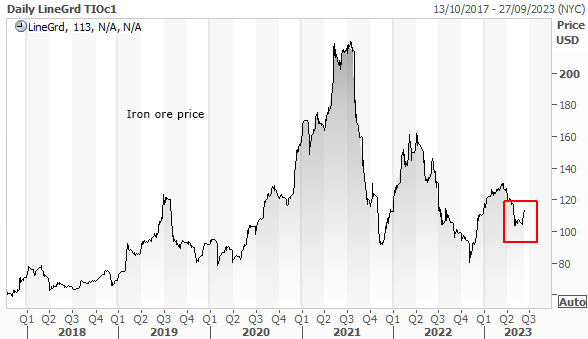
However, I tend to think that $85 to $90 is some sort of resistance level or natural floor for the iron ore price, unless there are clear indications of an impending over-supply situation, which there are not. Since early 2019, the iron ore price has gone back up every time it has got down to those levels (around US$85 to US$90/tonne).
All three of our big iron ore miners have costs that are sub-US$25/tonne.
FMG, whose iron ore tends to be lower grade than BHP's and RIO's, so sells for less per tonne, has traditionally been the higher-cost producer of the three, however they've really got their costs down over recent years; and they've now become the lowest cost producers globally, although we're expecting an uptick in costs for the current FY; they said in April (2023) that the higher price of diesel and explosives, rising wages in Western Australia and ore that was harder to access, had combined to force their direct costs up to $US17.73/tonne (A$26.56 a tonne). Clearly they will remain highly profitable at much lower iron ore prices than what we are seeing today.
Historical context: FMG trumps Rio, BHP in iron ore cost battle - MiningNews.net [24 February 2016]
BHP said in their first half review in April that their costs were tracking towards the upper end of their US$18 to $19/tonne cost guidance range - for WAIO (Western Australian Iron Ore) - due to the same cost pressures that FMG are experiencing. BHP hinted that their actual full year costs miight be a little above that range, but I still expect it to land below US$20/tonne and quite likely very close to $19/tonne.
Source: Page 4 of this: BHP Operational Review for the nine months ended 31-March-2023 and page 2 of this: BHP Operational Review for the Half Year ended 31-Dec-2022
RIO provided unchanged guidance in April for their 2023 Pilbara iron ore cash costs: US$21.0 to $22.5 per tonne, based on an A$:US$ exchange rate of 0.70. I expect that their actual costs will be at the upper end of that guidance, similar to BHP, and for the same reasons, so around US$22.50/tonne (and possibly as high as US$23/tonne).
Source: Middle of Page 3 ("Operating costs/Guidance") of this: RIO-first-quarter-operations-review-2023-pdf.pdf [20 April 2023]
Further Reading:
Rio Tinto Results: A ripping start to 2023 from iron ore's great procrastinator - Stockhead [20 April 2023]
RIo Tinto [ASX:RIO] Addresses Rising Ore Production, Costs and 2023 Guidance - Daily Reckoning Australia [17 January 2023]

So, all three are solid and will remain profitable at much lower iron ore prices, although I expect the iron ore price to continue to bounce off that US$85 to $90/tonne mark, and get up to around that US$160/tonne level when the market gets bullish on iron ore, such as if we see significant Chinese economic stimulus, as some are predicting (again).
My base case is an average iron ore price of around US$100/tonne, and a little lower than that for FMG because of their ore quality (percentage of iron in the finished product that they sell). They are working on value-adding and higher price iron products - such as their Iron Bridge Magnetite plant - see here: iron-bridge-first-production.pdf (fmgl.com.au)
...and Iron Bridge is producing Magnetite already, but they are still ramping up and aren't operating at peak efficiency yet, so my base case doesn't factor that in yet.
I am invested in FMG, and they are one of the top 3 positions in my two largest real life portfolios (including my SMSF) with only NST and CDA being larger positions. FMG is also currently the 4th largest position here in my SM virtual portfolio although FMG do move around in that top 4 due to their volatile share price. They are also a great income stock; they pay above-market fully franked dividends.
Some people see a major risk being that their Executive Chairman and company founder Andrew ("Twiggy") Forrest might start allocating more money to FFI (Fortescue Future Industries), a division of FMG that focuses on developing and monetising green energy and other green technologies that underpin a sustainable future for the planet, and that there will be less profits returned to shareholders in the form of dividends as a result of that reallocation of capital, and while that is indeed a real risk, I remain convinced that FMG will continue to both invest in FFI and maintain a healthy dividend yield.
The reason I am confident about that is that Twiggy has a lot of business and philanthropic interests outside of FMG, and the bulk of those are funded via the dividends he receives from his 36.74% ownership of FMG (shares held by his private family business, Tattarang). That's why I think it's reasonably safe to assume that while FMG remain profitable, those dividends will continue to be paid. The yield will move around, as will the share price (one affects the other), but I believe that FMG will usually pay above-market dividends into the future. And it's hard to envision a scenario in which FMG are no longer profitable. Not with those low costs!
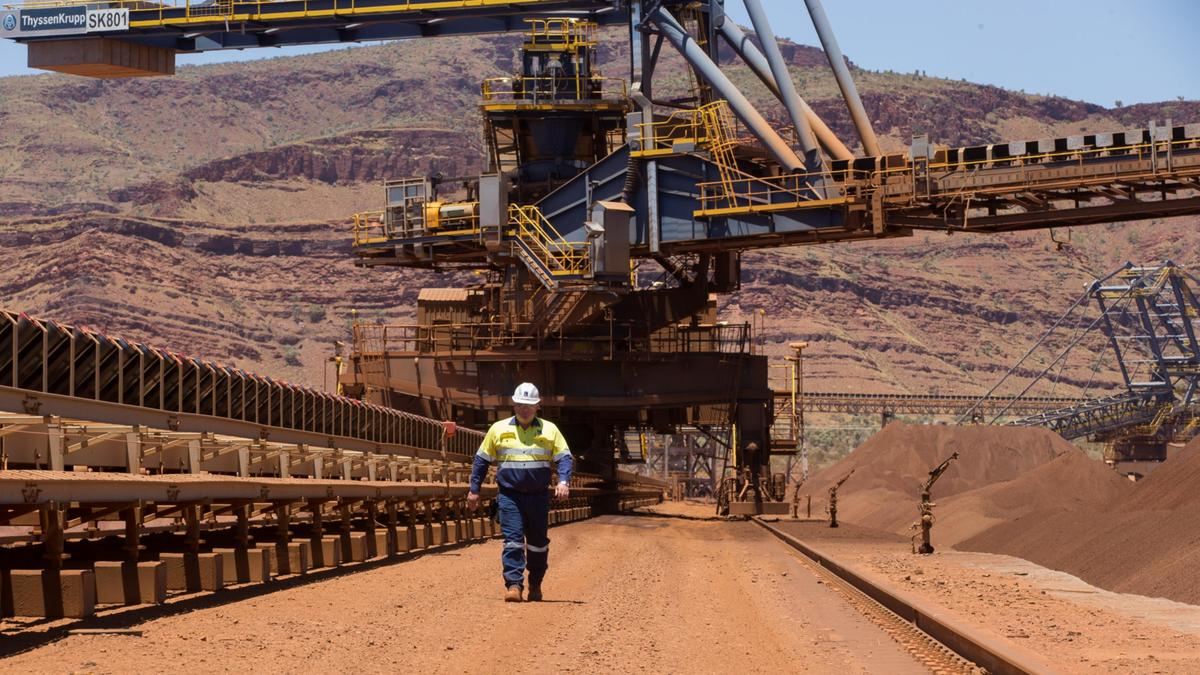
Anyway, as I said, I do hold FMG. I do sometimes also hold BHP. They're back on my watchlist, but I'm not holding them currently (as I type this). I do NOT like RIO, and the individual contracts they make their workers sign, and I tend to avoid RIO. I hold S32, which was spun out of BHP, and produces Bauxite, Alumina, Aluminium, Copper, Silver, Lead, Zinc, Nickel, Manganese and Met Coal (no thermal/energy coal). I like that mix, and for iron ore exposure I prefer the pure play that is FMG. BHP and RIO both derive the majority of their revenue from iron ore, but both are diversified across other commodities as well. FMG just do iron ore. And FFI of course. But in terms of mining, it's just iron ore.
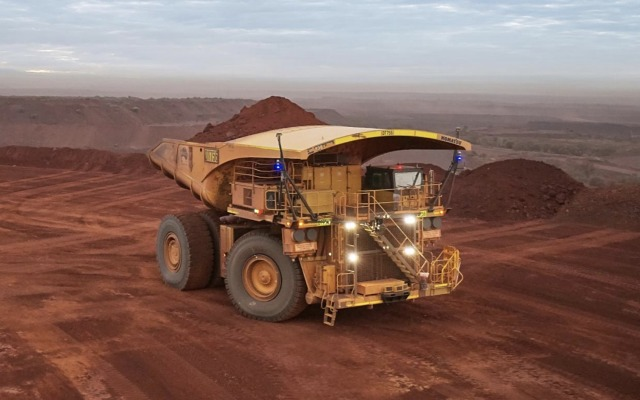
But my point was... it could be our commodity-based economy that sees us outperform the US market at some point, for a short time at least, particularly because the US market has had a very good run of late on the back of their tech sector, which looks expensive again. It will probably get more expensive from here, but then again, it might also correct if it gets the right catalyst to do so. The Aussie market has underformed when compared to the US market, and that would be because our technology sector is tiny compared to theirs, tech being a dominant market driver for them, and while our mining companies are firmer, they clearly have further room to move on up from here without looking too stretched.
There are always a multitude of other factors at play as well of course, but just on that basic level, I can understand the divergence of performance between the US and Aussie sharemarkets, and can envision a scenario in which we could conceivably outperform them, although that would probably result from their tech sector correcting at the same time as our mining and materials (or "commodities") sector(s) outperforming.
Something else to consider is that with what has happened in the US (their tech sector providing the basis for outperformance this year), and what might happen here under the possible scenario I have just outlined, the two scenarios have something in common, and that is that in both cases: A rising tide does NOT lift ALL boats. Mostly because the tide is not rising in a uniform manner. It is more like a "swell" in some areas and not in others. Or a tech tsunami that has much flatter ocean levels behind it. So, not only do you need to be in the right sectors... picking the right companies to back within the right sectors will also be important, because there will be winners and losers in those sectors, as with every sector, even sectors where most companies have rising share prices or sectors where most companies have falling share prices. There will always be exceptions.
I'm not saying thematic investing does not work, just that good stock picking within those sectors adds value - and can certainly increase your potential returns.
But it all starts with some assumptions, and some guesswork I suppose - in terms of sectors at least. So whether you get those calls right or wrong can make a big difference too.
Or you can ignore the macro and just focus on good businesses that should perform very well in a wide variety of operating conditions, including in much worse conditions than what they enjoy at this point in time.


