In this third and final straw supporting my recent valuation of $WTC, I examine the cost structure of the business and set out the rationale for its evolution over time. I conclude with some remarks about risks.
Straw 1 assessed the competitive market opportunity and identified the potential for $WTC to grow over the 20 years 2022 to 2042 as it establishes the operating system for global logistics. Under the scenarios modelled, $WTC grows to achieve between 5% and 10% share of the global logistics software market, up from an estimated 1% today. So, while by any measure it’s a Bull Case analysis, it's one that doesn’t require global domination! Straw 2 then explored how $WTC grows revenues from existing customers, by analysing how each existing customer “cohort” has grown over time. The analysis showed that $WTC likely has a decade or more of strong growth locked in from those customers it has already contracted today. Beyond that, if it expands its customer offering to encompass the entire logistics ecosystem, it will not run out of growth headroom any time soon.
What remains for this straw is to examine the profitability (cost structure) of $WTC and analyse how this might evolve over time. The approach is simple:
- Start by understanding $WTC margin evolution to date
- Develop a peer group of global industry software leaders, establishing these as possible long term futures for $WTC
- Assess the high-level similarities and differences, leading to the scenarios for $WTC cost structure evolution.
1. Margin Evolution to Date
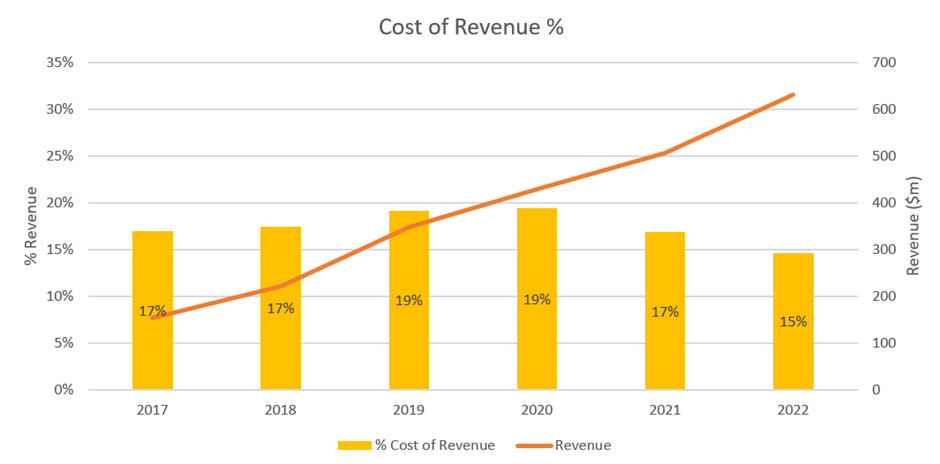
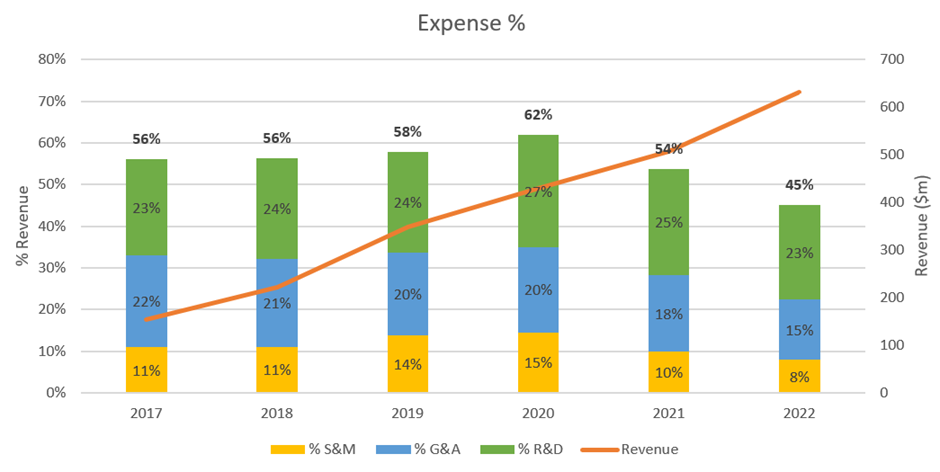
Figure 1 and Figure 2 show the evolution of Cost of Sales and Expenses, respectively, both as a % of revenue.
Figure 1 $WTC Cost of Sales as a % of Revenue
Source: Company Accounts
Figure 2 Expenses as a % of Revenue
Source: Company Accounts
In both cases, the period from 2017 to 2020 saw increasing costs, followed by clear downward trends in the last two years. These trends are easy to explain. Between 2016 and 2020, $WTC acquired 28 businesses, both expanding its global market footprint and acquiring functionality to be integrated into Cargowise, as noted in Straw 2. The acquired businesses were generally small, with high relative costs contributing to the progressive erosion of % margins. This has been communicated clearly in investor presentations over the last 5 years.
Over the last two years, $WTC has undertaken an efficiency drive, removing overheads and turning off legacy platforms as the functionality has been progressively integrated into Cargowise. This led to both Gross Margin increasing to 85%, and Expenses have been driven down to 45%. Again, CEO Richard White (RW) has explained this clearly over recent presentations.
Over time, I expect the general trend of increasing margins to continue as operating leverage progressively expands. Of course, it won’t be a linear process. For example, the three most recent and historically large acquisitions will likely temporarily move margins backwards again. In the case of the 2023 acquisitions, these will be run as separate software programs, while $WTC takes time to figure out the best way to integrate them into the Cargowise stack. However, even if the transition takes 2-3 years, it is not going to be material in the overall scheme of the next twenty years. $WTC now has a track record and an established internal capability of integrating acquisitions and driving efficiency.
So, the key question in developing the valuation was to evaluate how these margins might be expected to evolve into the future, over the long term.
2. Margins in the Global Software Giants
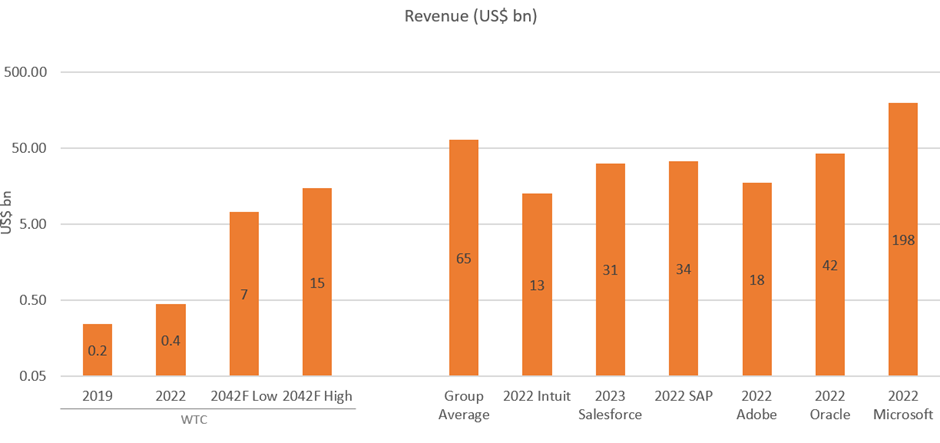
To understand how margins at $WTC might reasonably evolve over the next two decade, a group of global software giants who have already made the journey to scale were considered. The “Peer Group” selected are shown in Figure 3, with their current revenues compared with $WTC’s current and future modelled revenues. Note that the vertical axis is a log scale! We might think of $WTC here on Strawman as a big company, but when viewed through a global lens, it really is still a Baby Giant – or perhaps at least an adolescent.
Figure 3: Revenues for $WTC (Actual and Modelled) and the Global Software Peer Group
Source: Company Accounts
Considerations in selecting the peer group:
- Intuit – similar in revenue today to that modelled for $WTC for 2042
- SAP and Oracle – global competitors, already active in the logistics software ecosystem (focus on Transport Management Systems)
- Salesforce and Adobe – global pure SaaS players
- Microsoft – a giant, diversified, much more than software but likely shows a limit on G&A operating leverage
3 Evaluating Margin Evolution at $WTC
3.1 Gross Margin
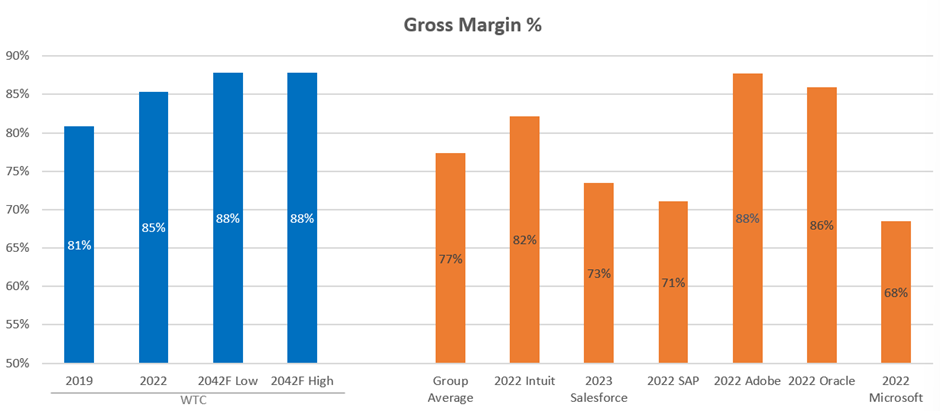
First up, gross margin. Figure 4 shows how the Peer Group compares with $WTC.
Figure 4: % Gross Margin
Source: Company Accounts
First, we can ignore $MSFT. With its hardware and cloud computing divisions, it will have lower gross margins than the pureplay software cos.
The clear leaders are $ADBE and $ORCL, with GMs of 88% and 86% respectively. Looking at $WTC, even though it is two orders of magnitude smaller than these giants, %GM has gone from 81% to 85% as the business has scaled and acquisitions integrated into the unified Cargowise platform. At this level it already surpasses the remaining members of the Peer Group. Therefore, I have modelled that as $WTC scales, %GM expands to achieve the best-in-class level of 88% of $ADBE by 2042. I’ve modelled this as a steady progression over time although, in reality, things will ebb and flow, particularly as $WTC continues to acquire capability and market position through M&A. I haven’t varied this between different modelled scenarios as I don’t consider it to be a significant uncertainty. Conceivably, it might under- or over-shoot, but this is a relatively unimportant sensitivity in the SP.
3.2 Expenses
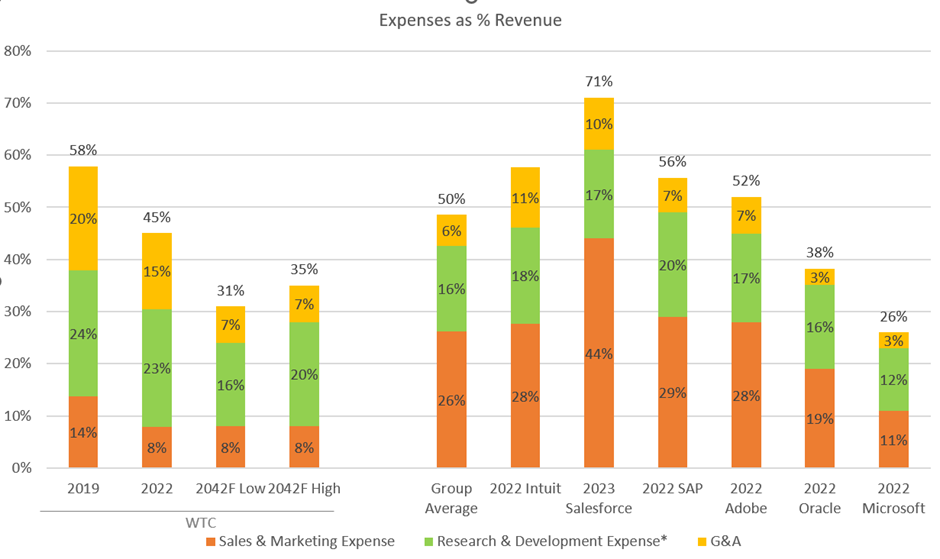
Next comes the expense categories Sales and Markets (S&M), Research and Development (R&D) and General and Administration (G&A), including their embedded components of depreciation and amortisation. The analysis is shown in Figure 5.
Figure 5: Expenses
Source: Company Accounts
Let’s consider each element in turn.
Sales and Marketing
Operating leverage has seen S&M% for $WTC fall rapidly from 14% to 8%, which is remarkably already significantly lower than the peer group, including $MSFT which has huge brand value. Reasons for this probably lie in its B2B and logistics sector pureplay focus, plus its established brand value in the global freight-forwarder segment. While it is possible that $WTC will continue to enjoy further operating leverage, there is an argument that the game gets harder from here on. Hitherto, most of its growth has come from its core capability of freight-forwarding, where it is already a market leader. Over time, as it seeks to enter and then build a leadership position in other parts of the software ecosystem for logistics (discussed in Straw 1), it will face increased competition from the players already established in those segments (think $ORCL and $SAP in global transportation). In order to reflect this expected increased competition, I’ve held %S&M spend constant at 8% in all scenarios modelled. Another argument to hold it at a constant %, is that as new modules are added to Cargowise, there will be an ongoing need to engage existing cusomters to make the case for extending global rollouts. Of course, it shouldn't be a hard sell at customer efficiencies should propel the business case for adoption.
G&A
Again, %G&A has fallen from 20% to 15% from 2019 to 2022. G&A is an expense segment where economics of scale should continue to apply. This can be clearly seen when we look at the Peer Group. $WTC is assumed to progressively reduce %G&A as it scales to a limit of 7%, consistent with that achieved by $SAP and $ADBE. The valuation is probably conservative in that $WTC’s industry focus and software pureplay business model likely means that a leaner corporate structure relative to the competition should be achievable. The gap from 7% to the 3% achieved by $MSFT and $ORCL is further potential upside in the valuation.
R&D
R&D is the largest expense and strategically most important. In the model, I assume that $WTC maintains a relatively high R&D spend – 16% in the high valuation scenarios and 20% in the lower valuation scenarios. The reasons are clear. If $WTC is to succeed in building the operating system for global logistics over the next 20 years, it will have to continue to extend the existing platform. For the platform to be attractive to customers, they will need to continually invest to reduce the friction of customers moving from their existing solutions and onto Cargowise in a way that helps customers reduce their costs. $WTC will therefore need to continually refresh its technology stack to stay at the cutting edge of user experience and information technology, including ML, AI and process automation. This will require perennial investment as well as attracting, developing and retaining top talent.
$WTC’s focus on logistics confers an advantage over its key competitors $SAP and $ORCL, who have to invest in developing solutions for a much wider range of industries and functions. $WTC’s focus will facilitate its ultimate success.
3.3 Bringing it all together
The relative focus on different margin levers will vary with time. RW has demonstrated in presentations over recent year that $WTC has a lot optionality in how resources are allocated. For example, when to push on M&A to accelerate the development of functionality (2016-2019) or when to focus on consolidation and driving efficiency (2020-2022). To date, $WTC has demonstrated that these levers can be pulled without impacting the momentum of revenue growth and supporting customers in their global rollouts.
This is where $WTC's global network of implementation partners is key. The partners (logistics IT consultants) do the heavy lifting of helping customers in their multi-year global rollouts (process mapping, change mangement etc.). The economics of the consulting business is essentially the cost+ model constrained my manpower. By having external partners bear this load, this further enables $WTC to retain a lean organisation model and to not be capacity constrained in supporting customer implementations.
RISKS
I briefly summarise three key risks as follows:
- Leadership: RW is the founder, major shareholder and leader of $WTC. As investors we like that, but the market has little visibility of the breadth and depth of the leadership bench below him. Several years ago, when the Bucephulus short report came out, management (RW) looked shaky in their ability to respond. This was widely perceived in the market and no doubt sent a warning shot across RW’s and the Board's bows. Developing the leadership bench and board strength will continue to be an important issue. Hopefully, RW’s vision will sustain him for decades to come. Equally, $WTC is at a scale that another capable leader should be able to take it forward should, for any reason, RW no longer be around. As investors, we have to trust the Board is regularly reviewing the succession plans, but it is perhaps a question to put the Board on notice at the AGM.
- Technology: $WTC continues to invest heavily in their SaaS platform, and with it disrupt many of the solutions currently in place in the industry. But all new technologies may in time themselves be disrupted. A key potentially disruptive technology in logistics is blockchain. RW has told me (2020) that this is a technology $WTC is tracking, and at this stage they don’t see it as a competitive threat. But it is one to watch as several initiatives are underway across the global in applying blockchain in supply chain management.
- Competition: $WTC’s progress to date has leveraged their leadership in the global freight-forwarding segment. However, the investment thesis relies on them succeeding across the entire global logistics ecosystem. Inevitably, they will have to take on leaders in other segments of this market (see Straw 1). It must be an open question as to whether they will succeed and, if they do succeed, what margins will ultimately be achieved.
- Cyber Security: $WTC holds mission critical data and entire process flows for its clients. A serious data security breach could disrupt operations, damage reputation and open the firm to a world of pain (e.g. litigation). I can't assess this risk, so the only way to manage it is through limiting position size.
CONCLUSIONS
When I started this deep dive, WTC’s SP was in the mid-$50s. When modelling outputs fell consistently in the range $49 to $98, I decided that risk and reward were heavily skewed to the upside. Today with the SP as $73 the market has also moved on. With the analysis described in these three straws, I have a framework to continue to track $WTC’s progress over the years. As I have gone into different aspects of the business, I feel that the market is probably now at fair value. That said, I have hopefully explained some of the areas in which there is scope for $WTC to continue to surprise to the upside. It remains my largest and highest conviction holding.
Disc: Held RL (6.0%). Not held in SM


