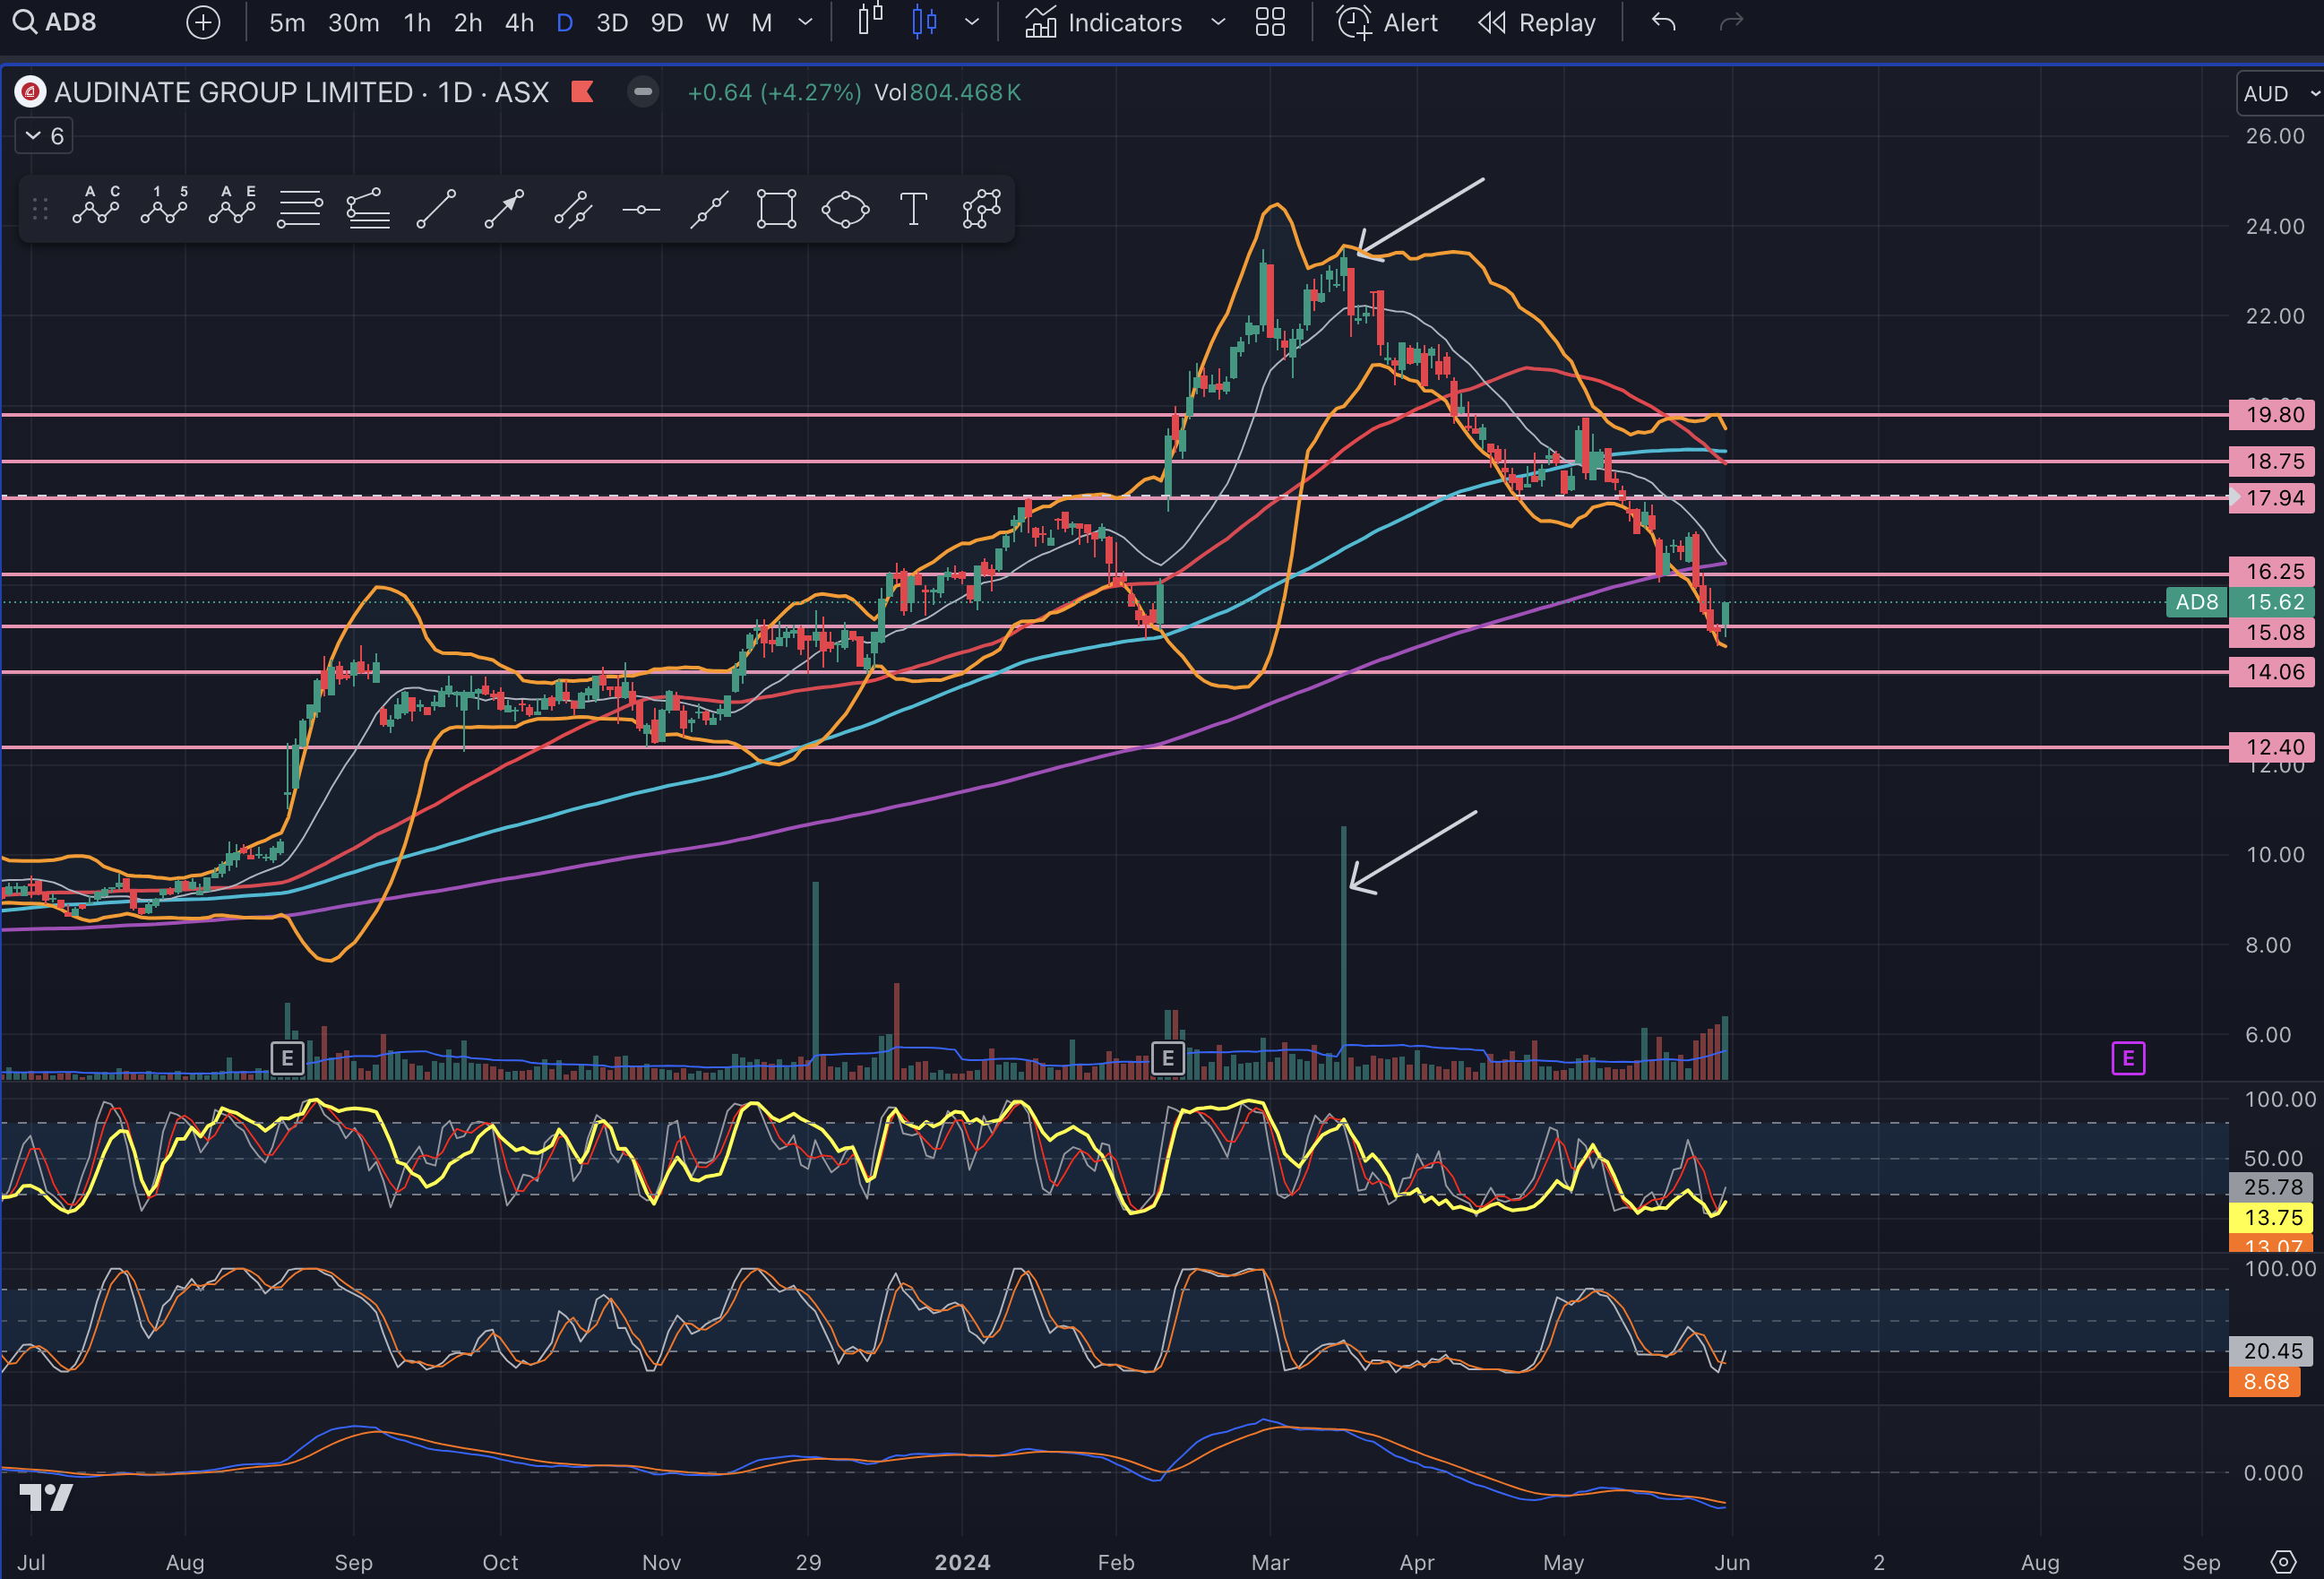
Oh sorry they are historical levels where the $ paused (the number of instances it has paused there, the stronger the Supp/res level for the future) and depending on where it was up to on the Stochastic indicators, Fibonacci levels etc determines if I were to take a positon. Remeber though nothing is perfect (could pause there and then continue on its way or turn around and go in the other direction). It simply icreases the probability of it heading in the direction you are after.

You question made me clean up the chart so you can see better.
Just while Im here, those white arrows point to an interesting day. Huge Volume and the bar hardly moved. The bulls were fighting the bears to break above the recent high a week or so before and the bears won causing a Double Top. See how the following day it dropped on small volume, the bulls just stopped to see what would happen. If I was part of that day, I would have sold my position at 3.58pm on that day or the afternoon of the next, sacrificing a little to make a more solid decision. Thats what I say in hind sight, but at least I can see it now. Thats a start
