Chart Update Tues 30th July
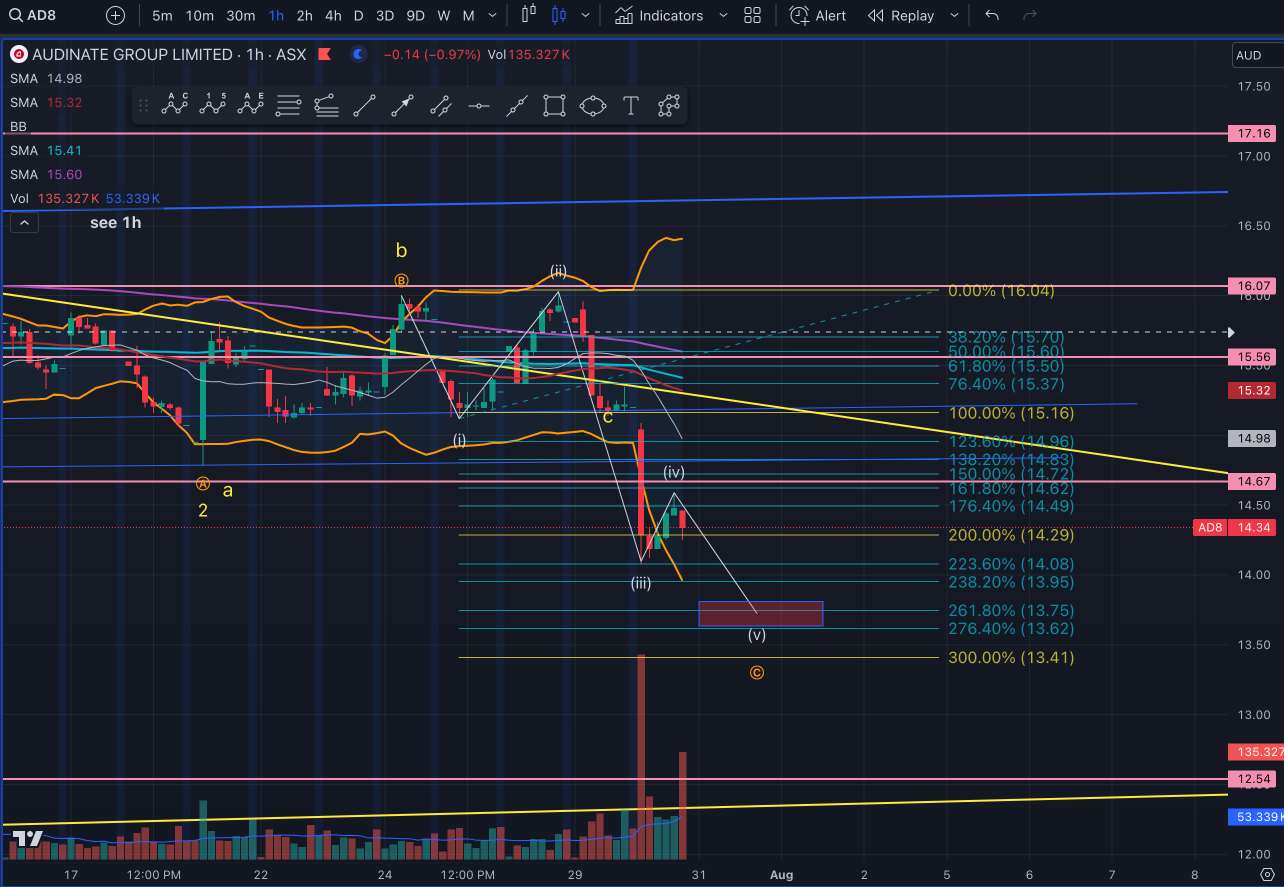
So after todays info and the explosive move down for w(iii) (dropping harder than the norm for a w(iii) ) we should be seeing the next stop at 13.75 ish for w(v).

however now we are getting close to the main rising Yellow trend line & Supp level (pink horizontal line) below (as well as 2 x Blue Trend lines).
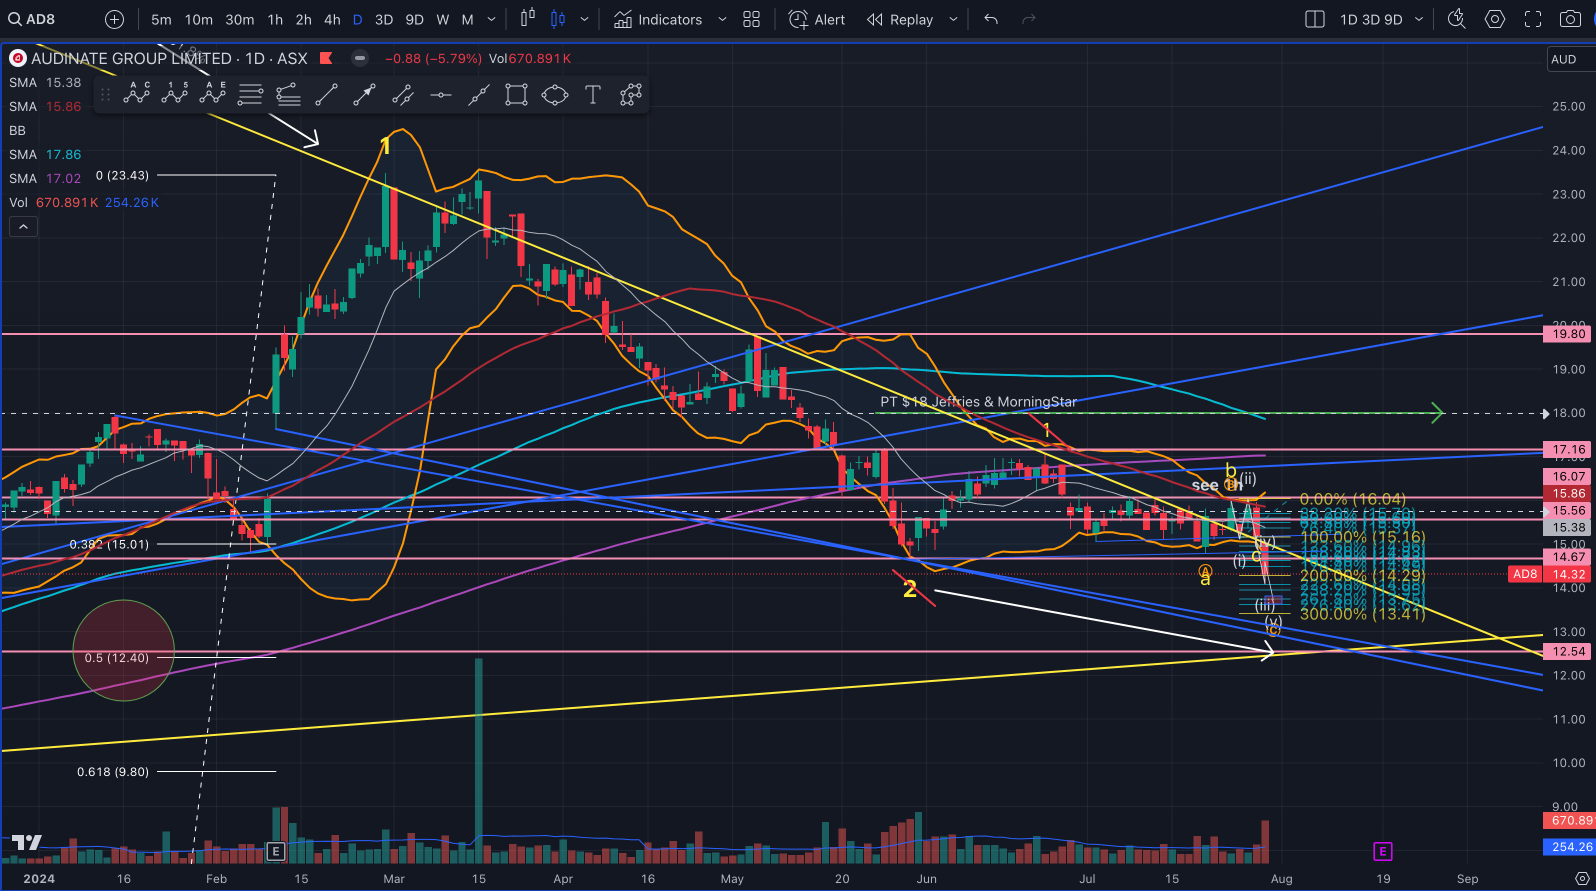
Zooming out on the 1d

What I thought might have been a w1 around June 24th has now been invalidated as we have taken that whole wave out. Also what I thought was the Super Cycle W2 now gets kicked further down the chart to the next major bottom to come.
There is loads of Supp down between the 12.54 - 13.03. When stocks drop close ish to good support they nearly always test it out. I will have to wait and see how it plays out over the next couple of weeks to see if its going to head down to those prices.
Also note the white Retracement levels on the left side of the secobd chart. It blasted below the 38.2% retrace of Supoer Cycle W1 over the last couple of days which opens the door to head to the 50% retracement level (circle on second chart) which aslo happens to be at those price levels with all that support.
Watch & Wait


