


Price History
Premium Content
Premium Content
Premium Content
So I'm sure a lot of you here listen to The Motley Fool Podcast, and there was a section recently on 'crimes in charting' and the benefit of companies that report clearly.
Below is a snip from the investor presentation from WDS today:
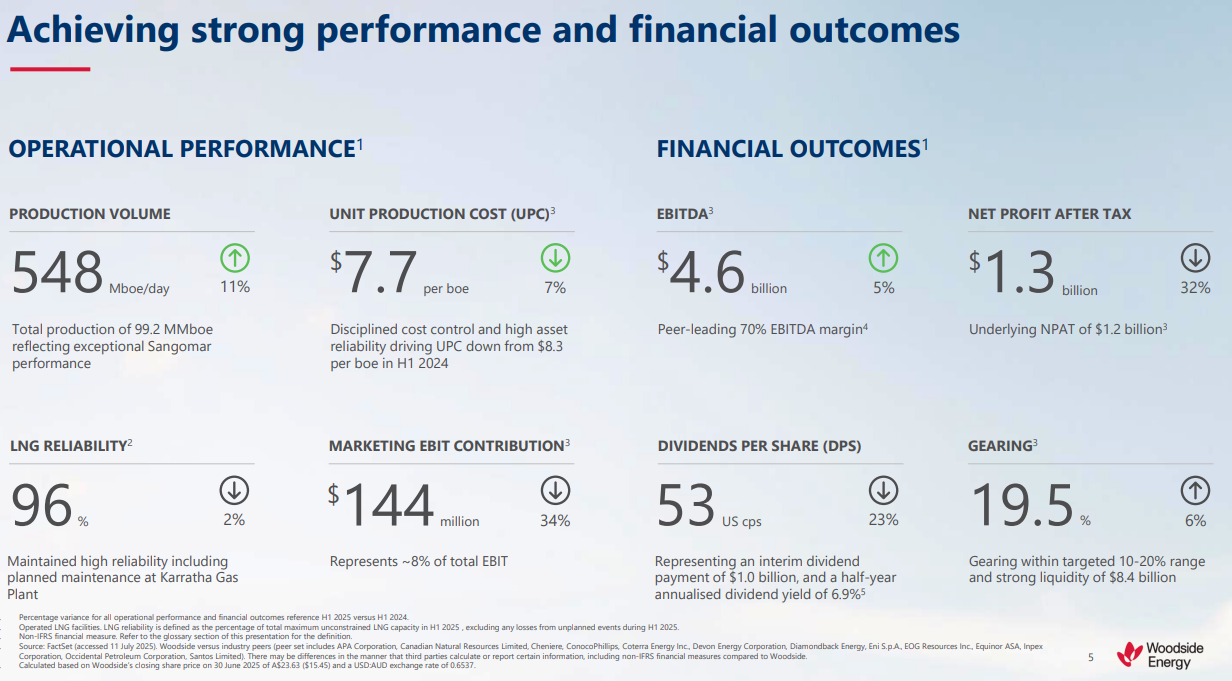
Nice and clear. Production volume up - good, Unit Production Cost down - good, EBITDA up - good, NPAT down - bad, LNG reliability down - bad, Marketing EBIT contribution down - bad, Dividends down - bad (fiscally responsible?), Gearing up - high end of targeted range ok.
So here's my dilemma. My macro investing strategy, when I am deploying capital, has always been very simple:
Big liquid companies, P/E of as close to 10 as possible (below is amazing), Dividend before franking credits of greater than 6% and share price below 52 week highs.
There's a few other things that I look at but this is my starting point.
Now WDS, with its share price dropping as I type this is still comfortably within these metrics. I accumulated when it got sub $20.
Here's the rub though, WDS is my biggest holding already and I am wary of the old 'too many eggs in one basket'. I am still bullish on WDS as demonstrated by my last valuation, but I'm wondering if anyone here would like to put a case for why I shouldn't buy more WDS (other than the obvious, got too much already).
Talking about dodgy charting, back when I was doing M&E I provided a chart to the bosses with the improvement that had been achieved by a project. It accurately represented what had been achieved. The boss was very unhappy with the graph, saying it 'didn't show enough improvement'. I obviously wasn't going to fudge any figures, so I simply changed the scale of the graph. Visually much better, cue happy boss, but data was the same. Misleading optically, sure, but if you read the data, factually correct.