Thats Bear in the short term (for now).
Im going to start posting here the Technical Analysis of the ASX200 as this ETF basically follows that Index
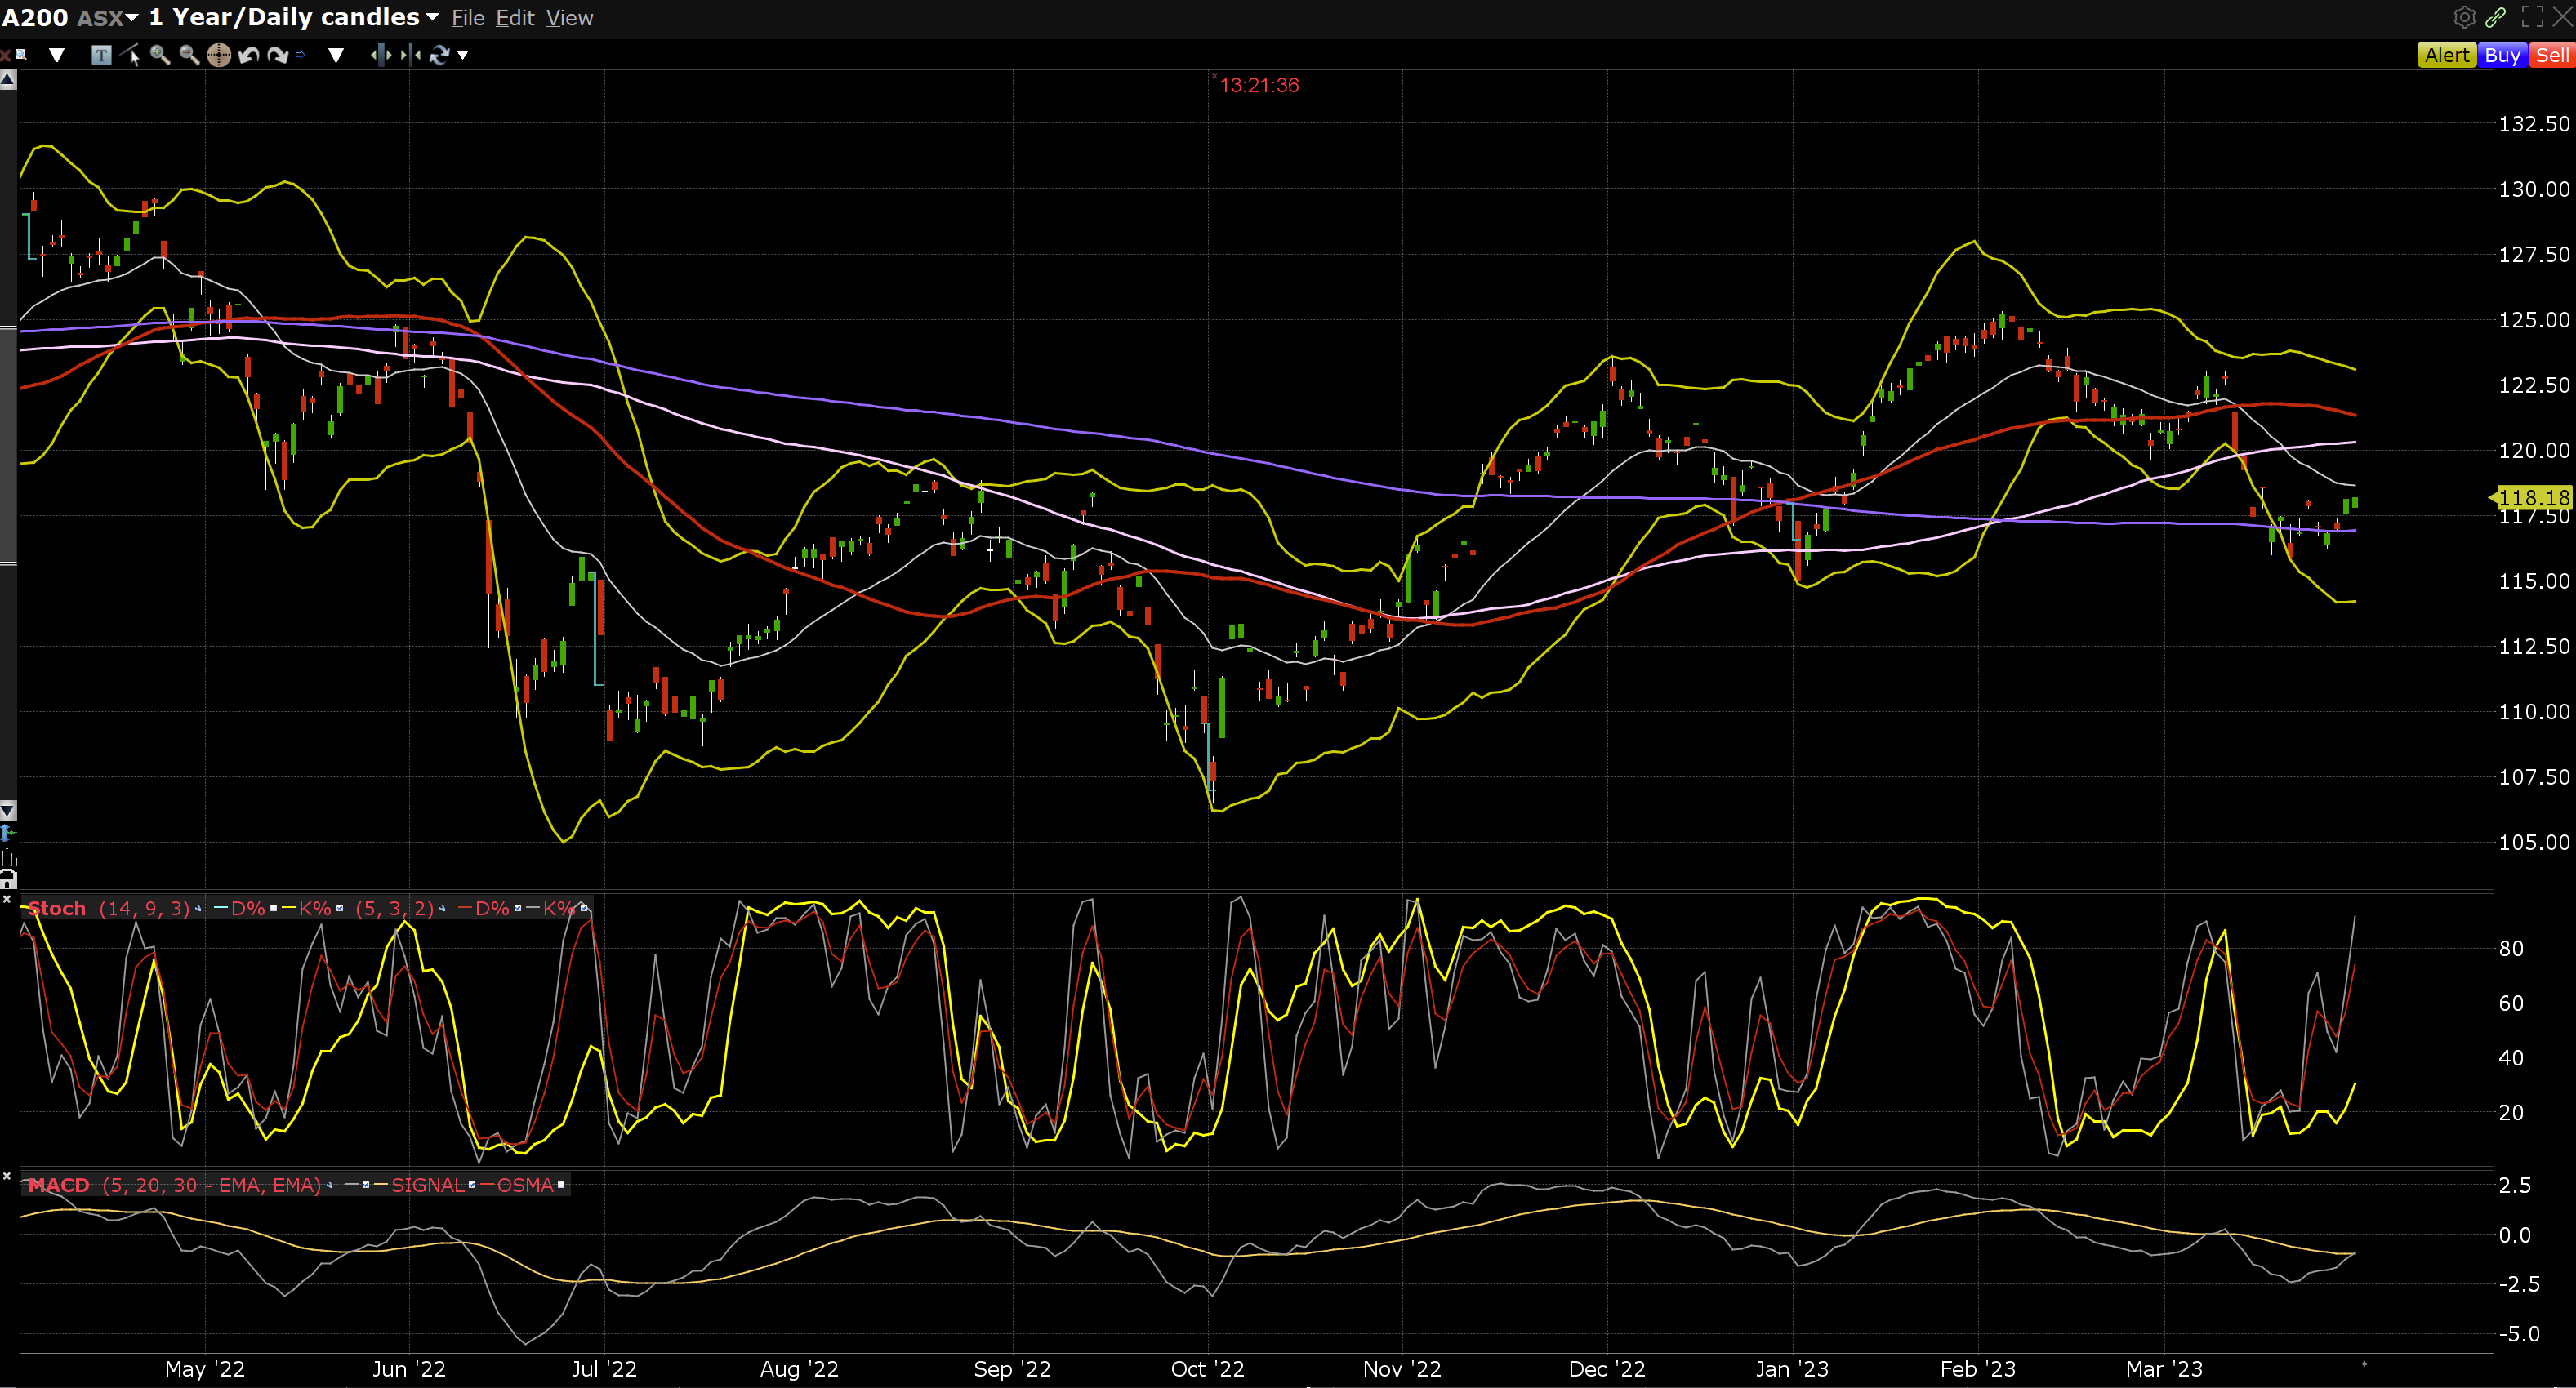
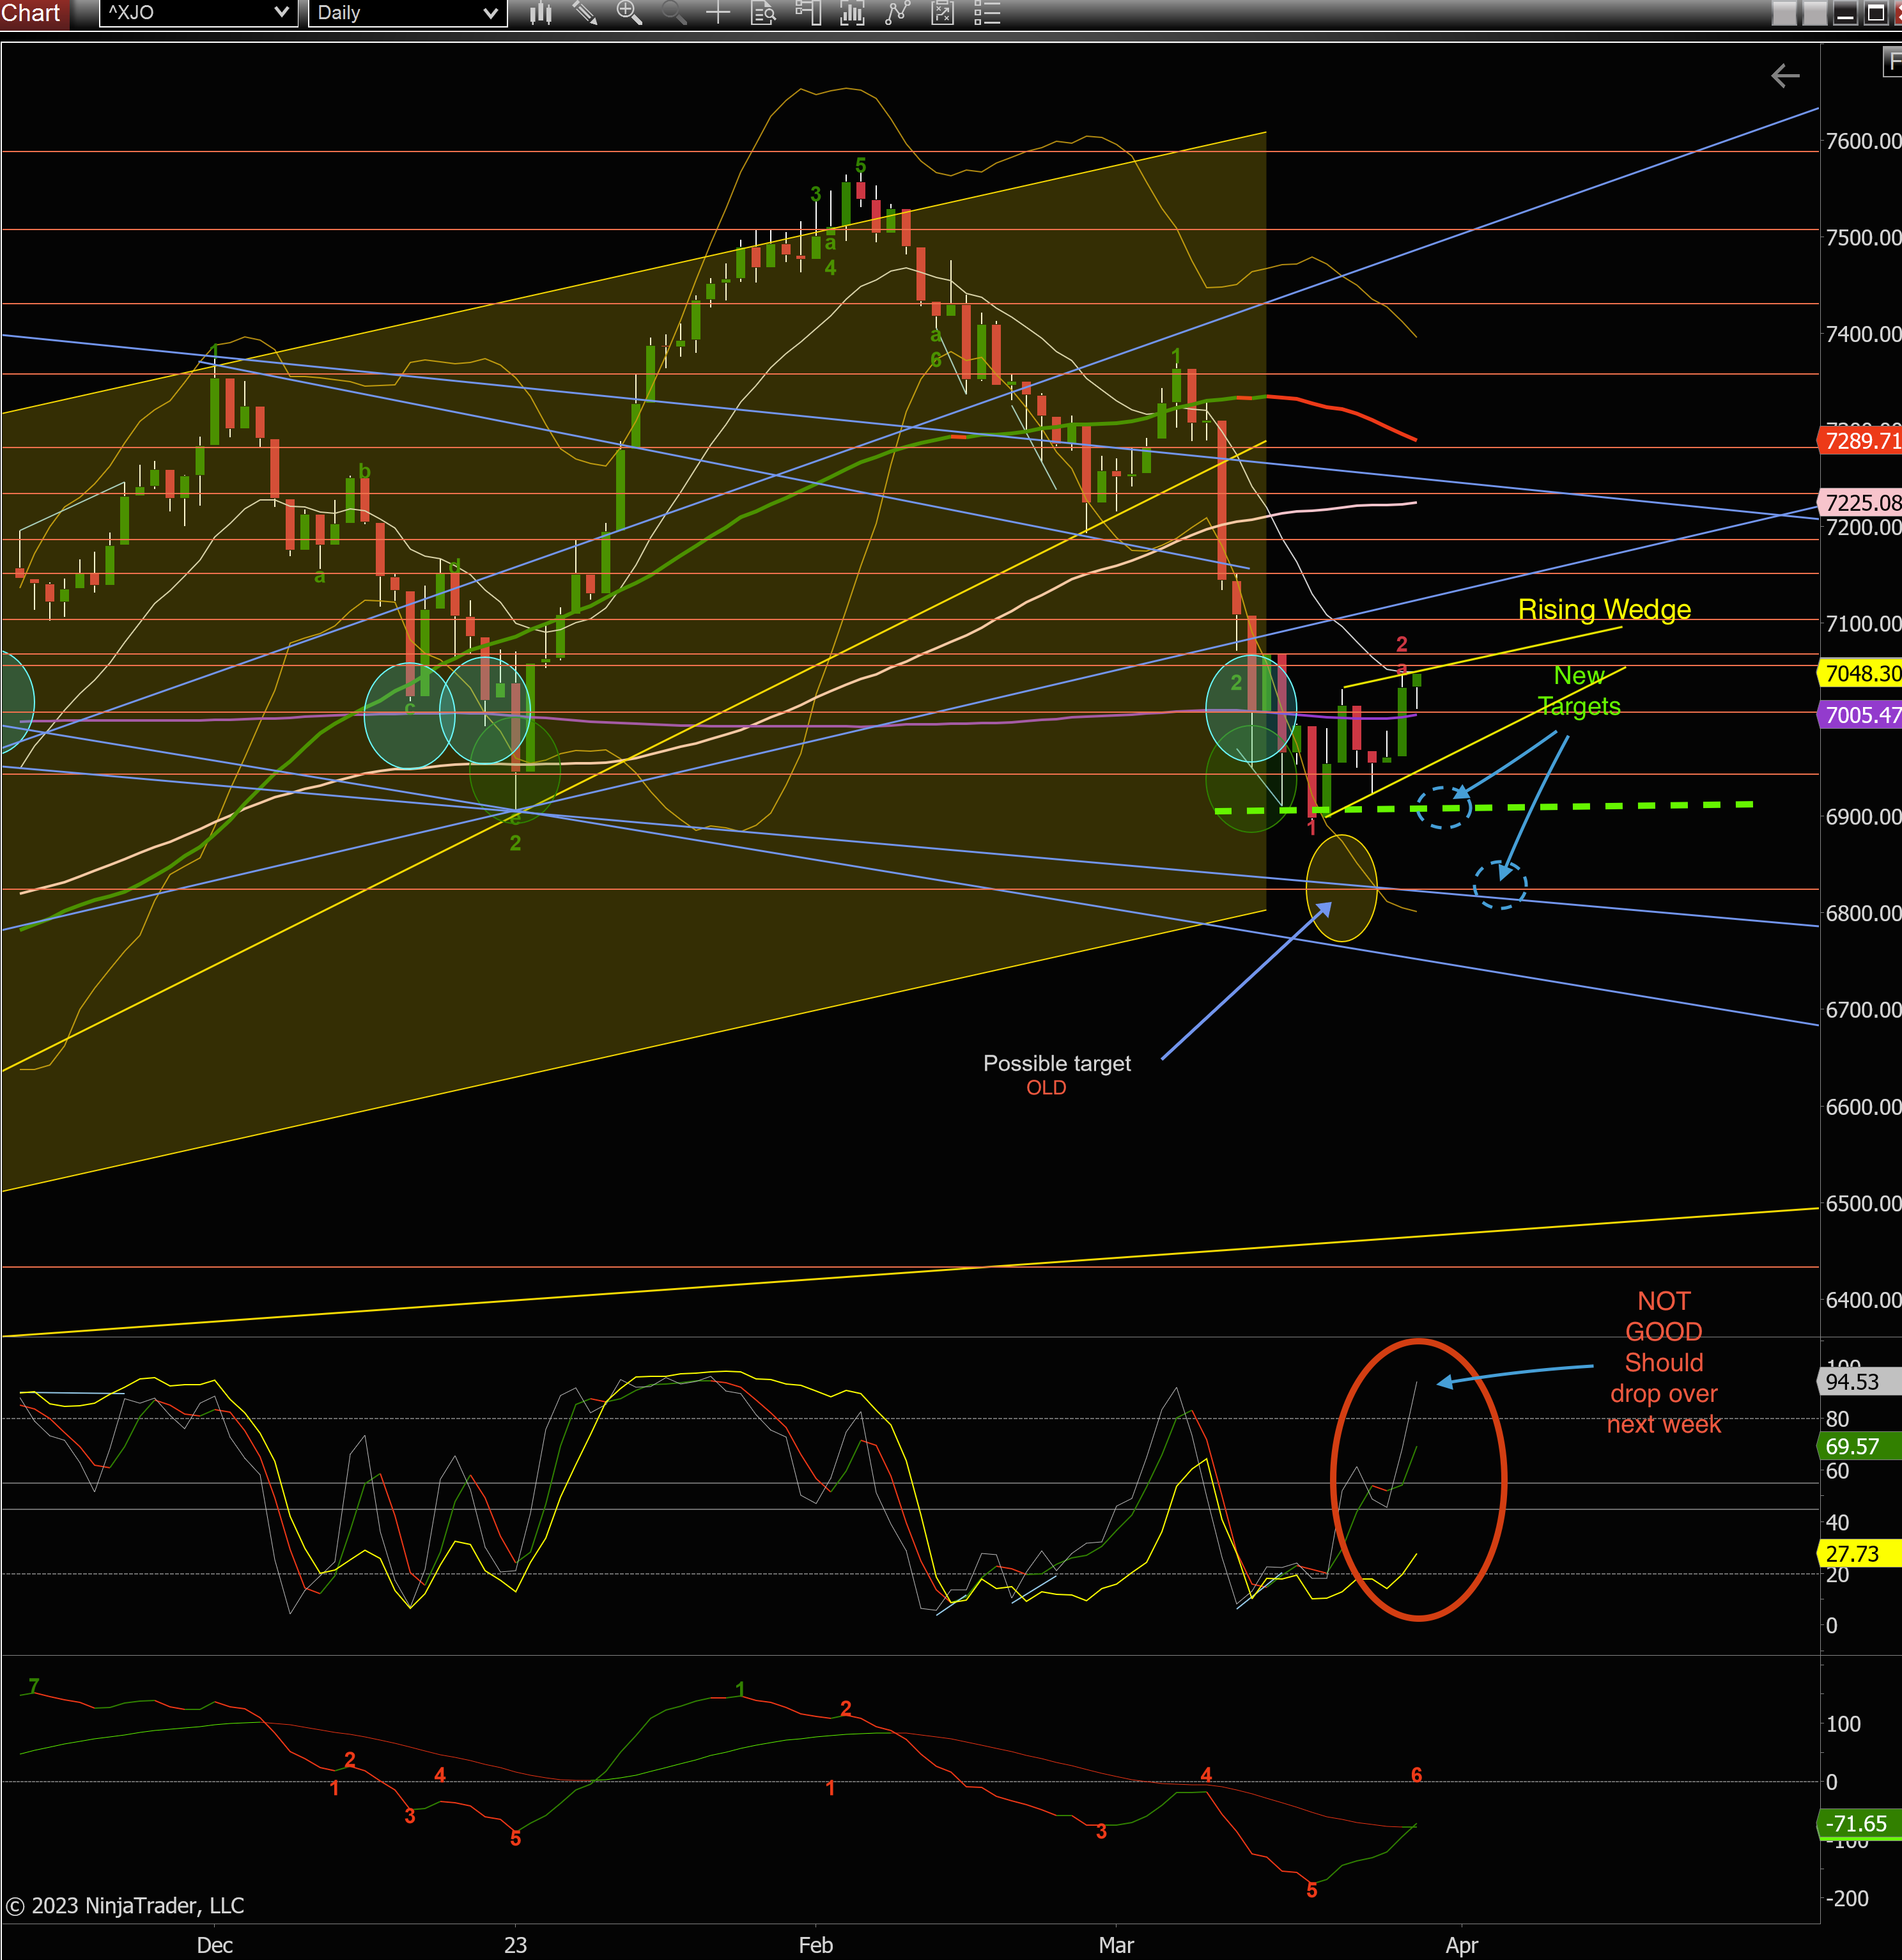
See the 2 charts below to see the same chart except the A200 is a tradeable etf. so has different numbers on the verticle scale.

Stochastic short term against long term is not good should revert back with ASX200 dropping over the next 3-4 working day possibly longer. The degree of the drop is uncertain. If it drops out of the Rising Wedge then look for it to continue down to the targets below. See the 2 x New Targets on the chart. The first traget is especially interesting because it could be forming a possible Double Bottom if it reverses from there with any gusto (Double Bottom patterns are very bullish if they complete). If it drops to the second Target below, then it will have just dropped out of the main Incline Channel its been in for some time. This would be a very bearish signal. Time will tell over the next month. Time for caution which ever way you look at it.

Eventually I will convert all my Notations onto the A200 ETF as I plan to start trading it soon. For those that arent familiar, just remeber:
asx200 is an Index therefore not tradeable
BetaShares Australia 200 ETF - asx code - A200 is tradable and tracks the asx200 above

