It's a good question @Stevie_B but not always the easiest to answer. There's various different cost metrics. There's AISC - All-In Sustaining Costs - and then there's CAIC, which is not disclosed by every gold mining company; actually I'll let ChatGPT explain it - for those who are new to gold mining:
Gold mining cost metrics are essential for understanding the financial health and operational efficiency of mining companies. AISC (All-In Sustaining Cost), CAIC (Cost of All-in-Production), and others serve different purposes in providing insight into the cost structure of a mining operation. Here's a breakdown of the most common terms:
AISC (All-In Sustaining Cost)
- Definition: AISC is the cost metric that accounts for all direct and indirect costs associated with sustaining the current level of production. It includes:
- Cash costs (e.g., mining, processing, and refining).
- Sustaining capital expenditures (e.g., equipment replacement, mine development, and maintenance).
- Exploration costs to maintain current operations.
- Corporate and administrative costs.
- Purpose: It’s designed to give investors a more complete picture of the ongoing costs of running a mine at its current scale. It’s a standard metric for comparing gold mining companies and their profitability.
- Pros: Provides a comprehensive view of all ongoing costs of sustaining a mine in operation.
- Cons: Does not account for expansionary or growth-related capital expenditures.
CAIC (Cost of All-in-Production)
- Definition: CAIC is similar to AISC but may have a slightly broader or more specific interpretation depending on the reporting company. It includes all costs necessary to bring gold to market, often with a focus on the production stage (mining, processing, refining).
- Can include direct mining and processing costs and refining costs.
- May not always factor in sustaining capital or exploration unless explicitly defined by the company.
- Purpose: The focus of CAIC is primarily on the direct costs of producing gold, including the final refining and shipping stages.
- Pros: Simple and useful for assessing the cost to produce gold specifically.
- Cons: Does not always include sustaining costs like capital and exploration, which are critical for longer-term sustainability.
Cash Costs
- Definition: This metric only includes the direct costs of mining and processing gold. It is the simplest cost metric and focuses on operational costs.
- Mining (digging and hauling ore).
- Processing (crushing, milling, and refining).
- Excludes indirect costs like administrative expenses, taxes, and capital expenditures.
- Purpose: Cash costs are used for quick operational cost assessments, focusing purely on production.
- Pros: Provides a good picture of the variable costs of producing gold.
- Cons: Does not capture all the costs involved in maintaining or expanding operations.
Total Cash Costs (TCC)
- Definition: Total Cash Costs combine direct mining costs with certain non-cash or indirect costs, like royalties and certain taxes. It’s a broader version of Cash Costs.
- Purpose: Gives an expanded view of the costs to operate a mine beyond just operational (mining/processing).
- Pros: Adds more detail than Cash Costs but is still mostly focused on operational costs.
- Cons: Still excludes long-term costs like sustaining capital and development.
All-in Cost (AIC)
- Definition: AIC is broader than AISC and includes all costs associated with getting the gold out of the ground and to market. It accounts for both sustaining capital and expansionary capital (growth capital).
- Includes development costs for new projects, and major expansions or refurbishments.
- Purpose: It’s a catch-all term for all costs related to producing and selling gold. AIC may reflect the overall "full" costs of running a gold business, rather than just sustaining current operations.
- Pros: Provides the broadest possible cost comparison, including expansion projects.
- Cons: Can be too broad for those interested in just the current cost structure or sustaining operations.
Unit Costs
- Definition: These are the per-ounce or per-tonne costs for extracting, processing, and delivering gold.
- Example: Cost per ounce is a metric that tells how much it costs to produce one ounce of gold.
- Purpose: Offers a granular view on how much it costs to produce each unit of output.
- Pros: Helpful for cost benchmarking at a specific scale.
- Cons: Can oversimplify costs and might not fully capture the broader operational costs.
Total Mining Costs - Summary of Key Differences:
- AISC: Most comprehensive for comparing ongoing operations, includes all costs to sustain current operations.
- CAIC: Focuses more on direct production costs, less inclusive than AISC.
- Cash Costs: The most basic, excluding indirect costs like capital expenditures and administrative costs.
- AIC: Includes all costs related to gold production, including major capital expenditures.
- Unit Costs: Offers a per-unit breakdown, useful for benchmarking cost per ounce or tonne.
In practice, AISC is the most widely used metric for comparing gold mining companies, as it gives a full picture of what it costs to maintain and sustain a mine.
--- ends ---
Not sure how accurate that data is because I've heard people say that CAIC covers more than AISC does and CAIC really tells you whether a company is making money or not. But not everyone discloses CAIC, and everyone discloses AISC, so from here on in this particular forum post I'll only refer to AISC out of all of those cost metrics mentioned above.
However, another way of looking at it is via cash flow comps:
Below is a chart that Ramelius (RMS) used in their own D&D (Diggers and Dealers) Presentation earlier this month in Kalgoorlie:
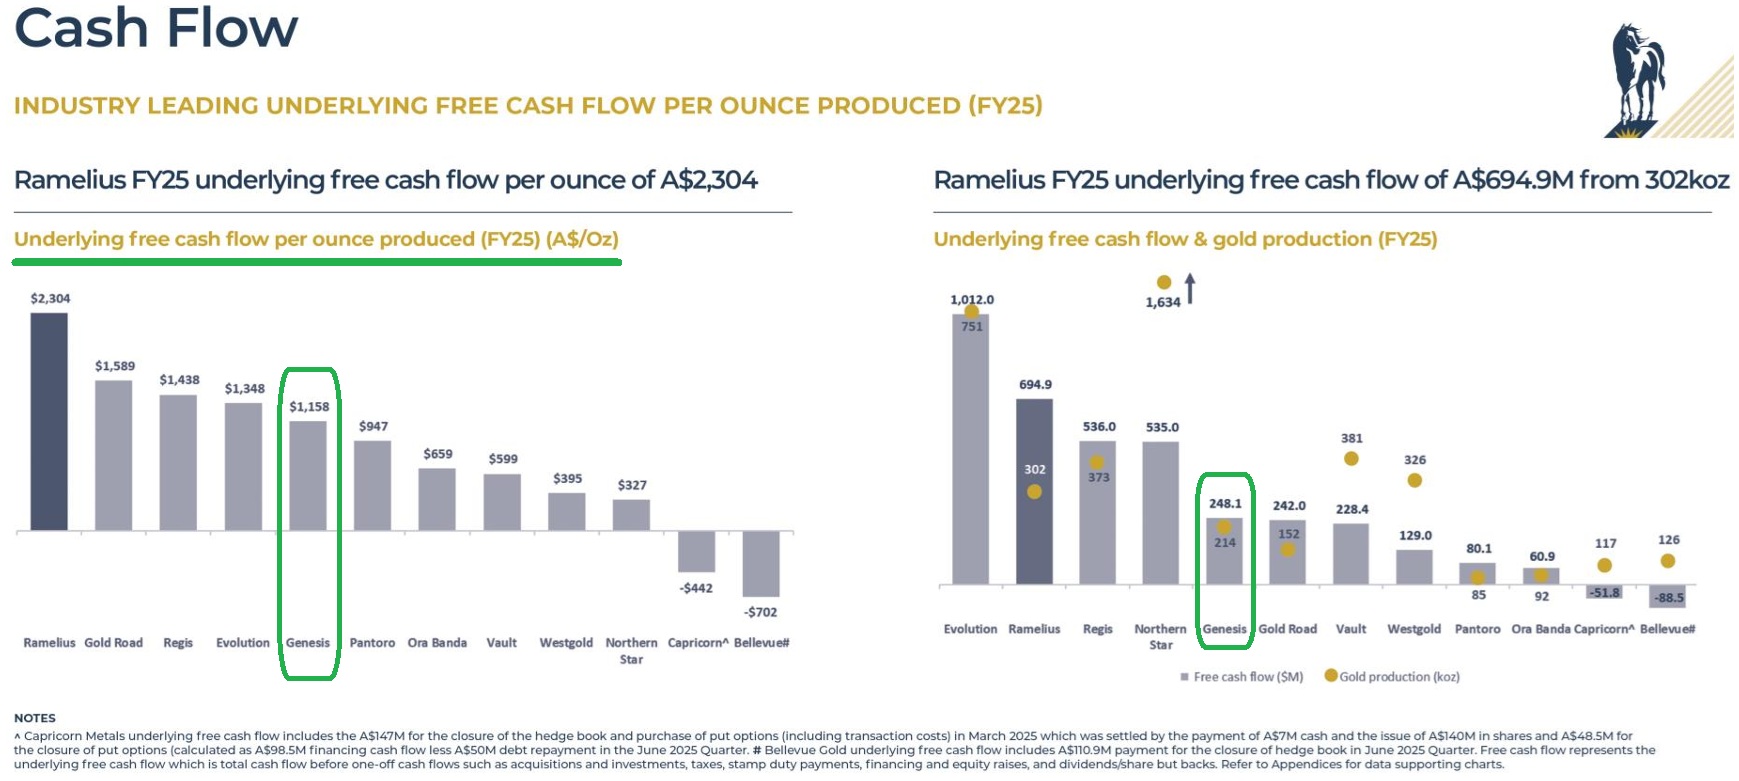
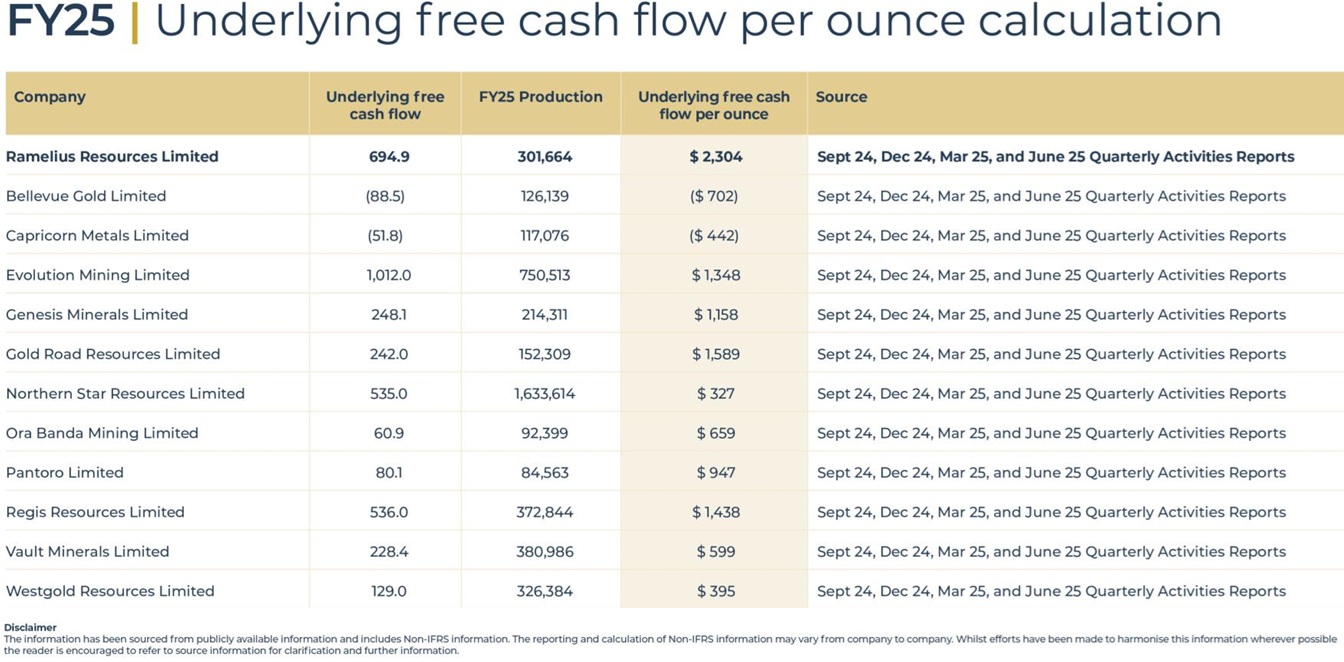
That (above) is slide 11 from RMS' D&D Presentation, and the following slides explaining how they derived those numbers above are slides 31 and 32 from the same presentation.
Before I show those slides, I want to point out that the stuff above on the left side are the PER OUNCE numbers, so each gold producing company's underlying free cash flow per ounce of gold produced in FY25 in A$/ounce produced. The numbers on the right are total ounces of gold produced in FY25 (the gold dots) and their total free cash flow, and Genesis (GMD) is the 7th largest producer in terms of gold production - the largest is NST with 1,634 koz Au in FY25, then EVN with 1,012 koz, then Vault (381 koz), Regis (373 koz), Westgold (326 koz), Ramelius (302 koz) and then Genesis (214 koz) at #7, yet they produced the 5th largest total free cash flow ($248.1 million), which aligns with their position on the left side in terms of also being #5 for free cash flow per ounce of gold produced; so Genesis are the 5th highest free cash flow producer per ounce of gold produced in FY25, with A$1,158 free cash flow per ounce, but it's a different set of companies ahead of them because it's a different comparison. Below, RMS explain how they worked that lot (above) out.
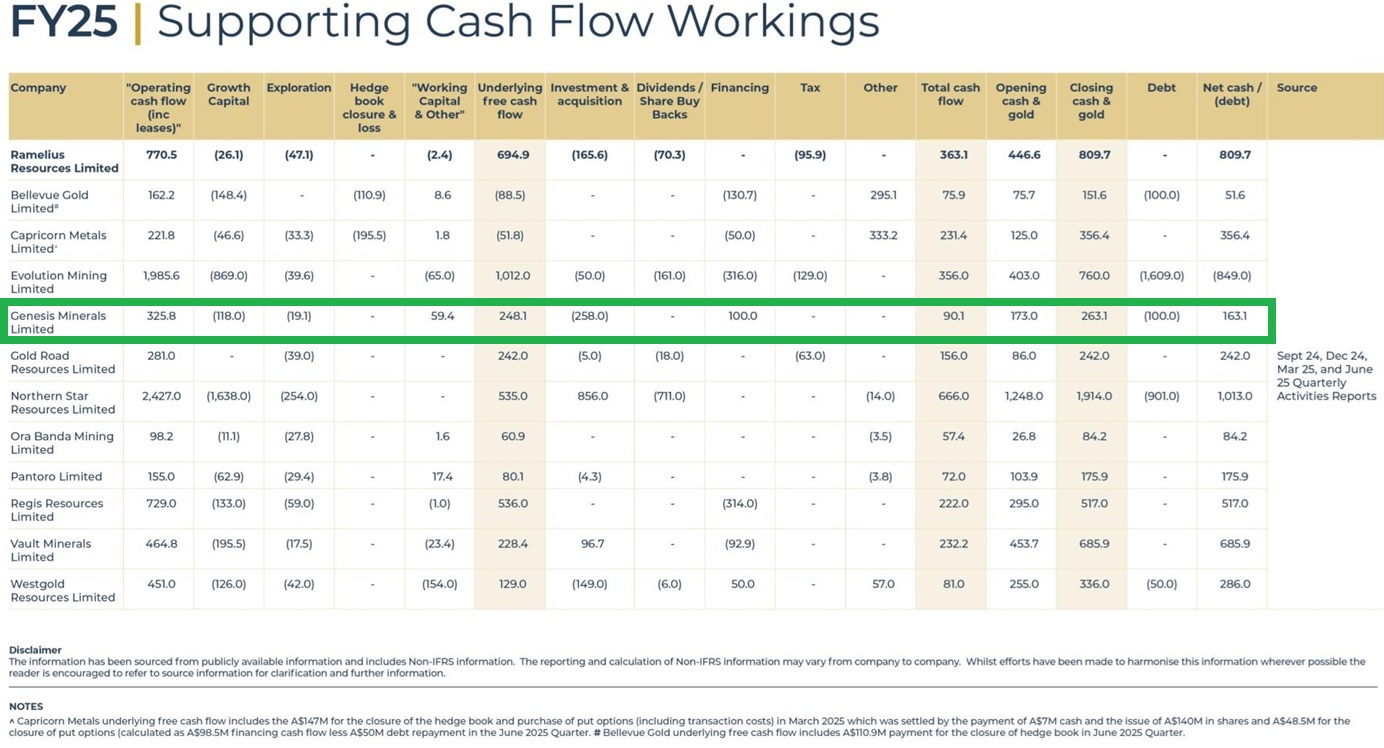
As you can see there (above) there's a lot of factors that go into it, and below RMS explain where they scraped those main numbers from.
And that's all to say that Genesis are punching above their weight in terms of free cash flow generation considering they only produced 248.1 koz of gold in FY25, but the context there is that they are rapidly expanding as all of their presentations make clear, so in a few years they expect to be producing over 400 koz of gold.
In the following graph from Genesis' own D&D Presentation this month (slide 19) they have excluded NST (Northern Star) and Evolution (EVN) which are ASX100 companies and are considered to be large cap gold producers by Australian standards, so Genesis are comparing themselves to what they consider to be their own peer group, being Australian ex-ASX100 gold producers with 100% Western Australian production, and they are comparing their gold Reserves and gold Resources to that peer group:
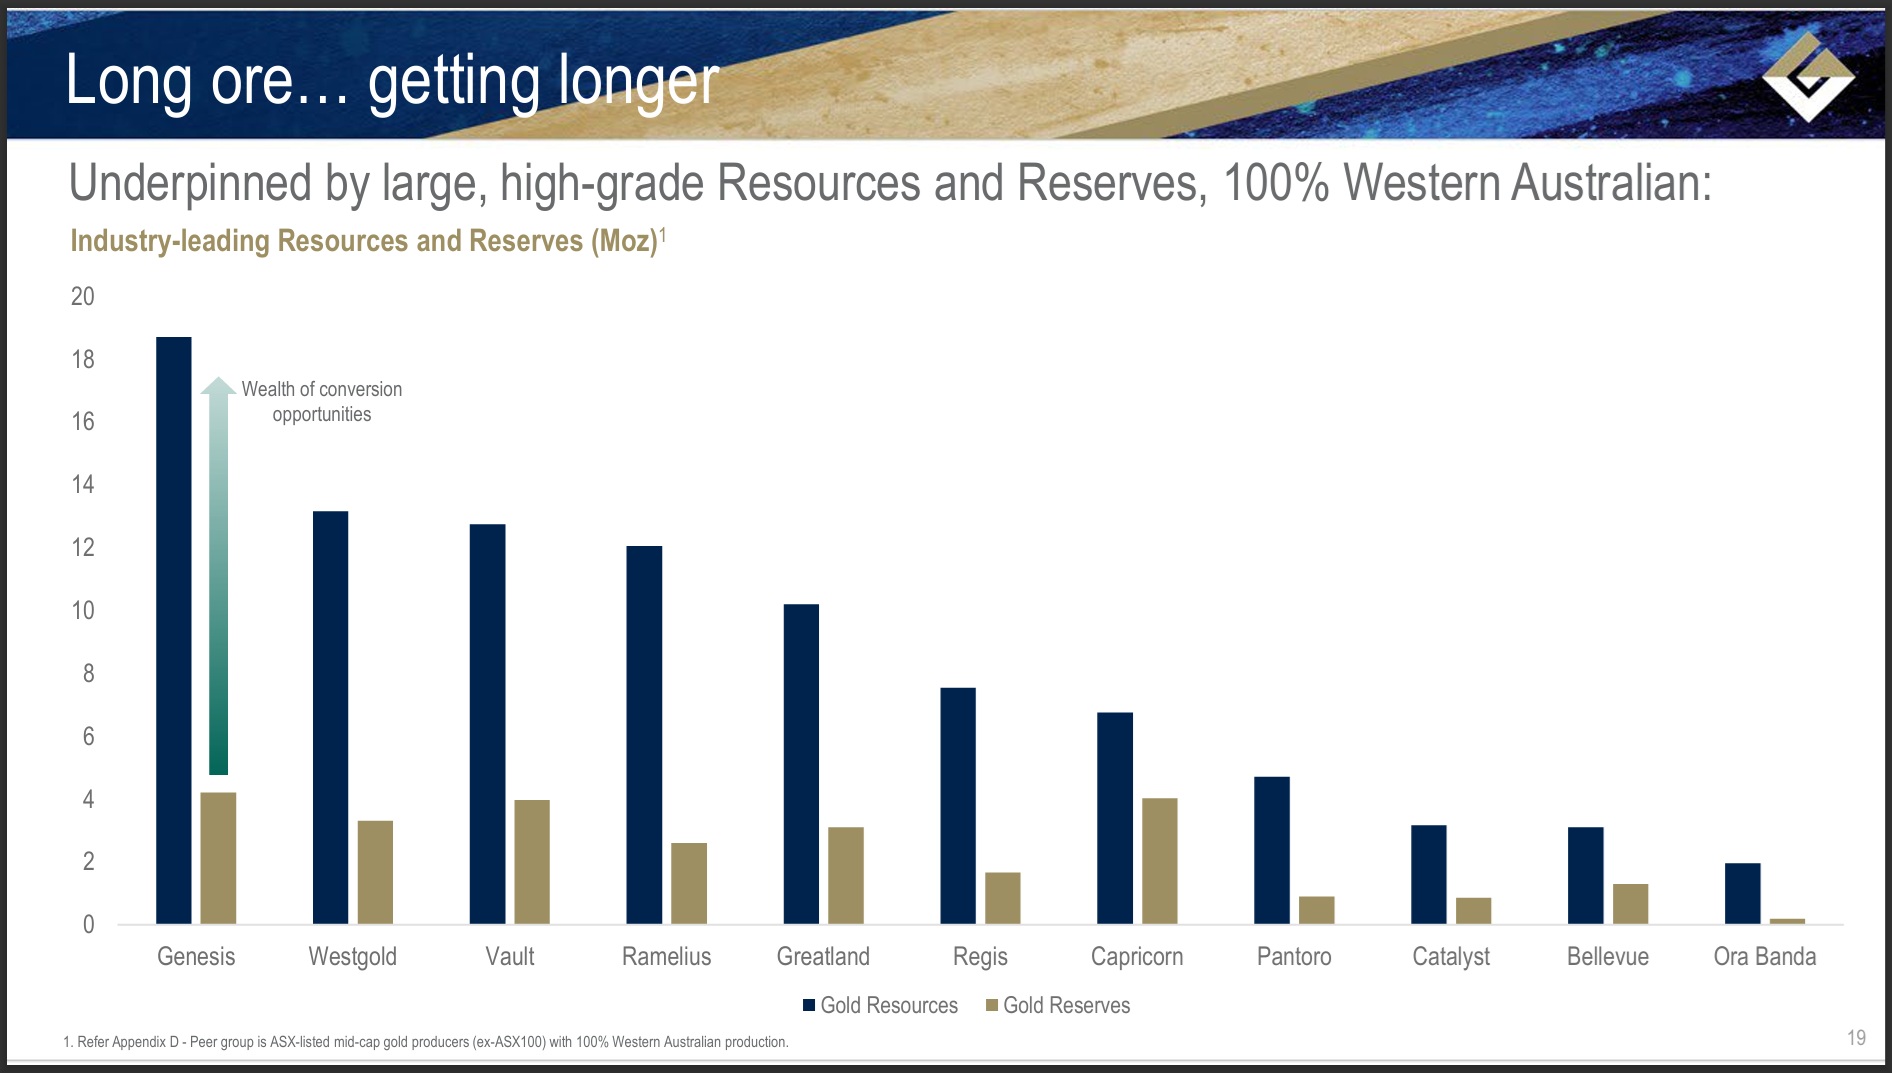
And they clearly come out on top with the largest Gold Resource now that they have purchased all of those additional tenements from Focus Minerals (FML). Gold Reserves however have a higher burden of proof, so much more drilling and assays and analysis needs to be done to convert Resources into Reserves, but as they put it there above, they have a "Wealth of conversion opportunities".
Their breakdown of where those Reserves and Resources are located is on slides 23 and 24 of that presentation, and the bottom half of slide 25 (reproduced below) shows where they scraped the peer data from:
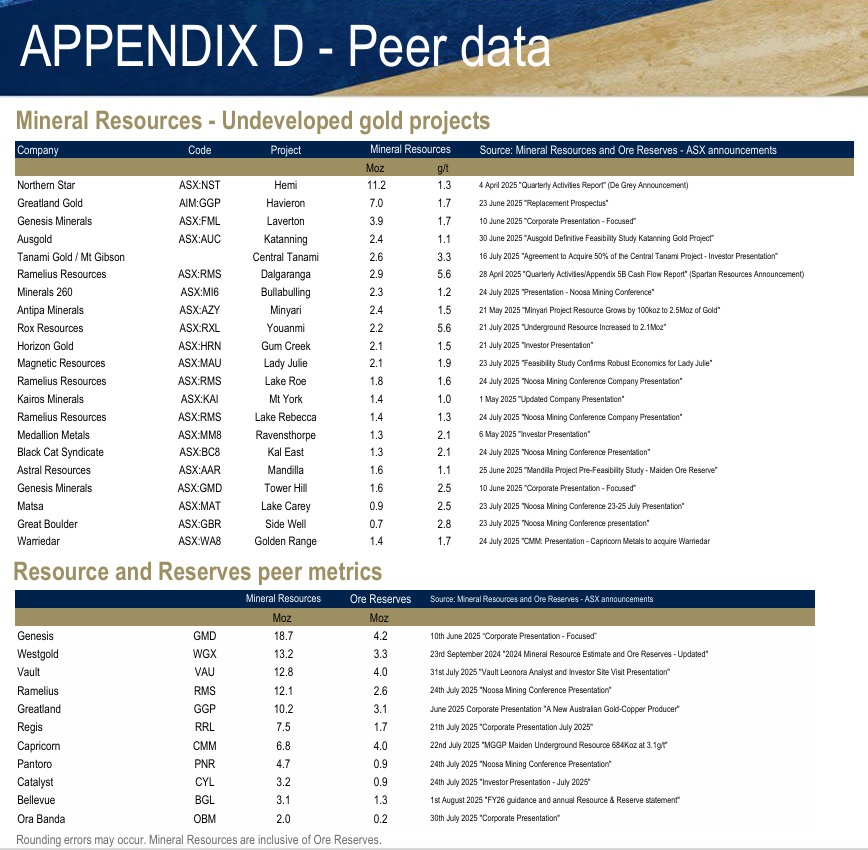
The top half of that slide above shows where they scraped the data from for the following "Undeveloped Gold Projects" slide:
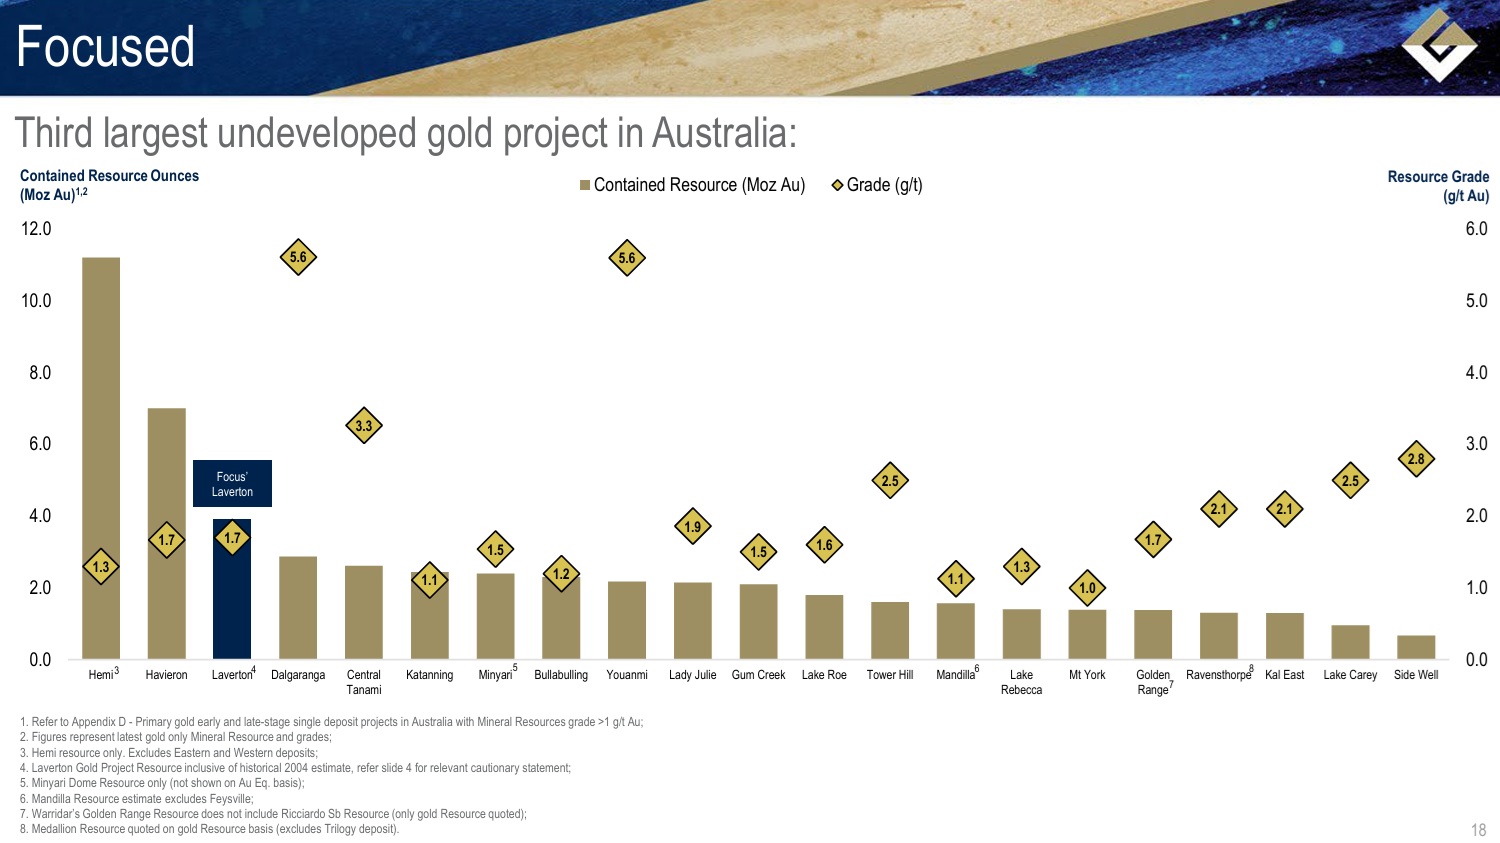
Now while they (Genesis) have the third largest undeveloped project ("Focus Laverton") behind NST's Hemi (acquired through the acquisition of De Grey Mining recently) and Greatland's "Havieron" (acquired from Newmont) that is not far from GGP's Telfer mine in northern WA, you might notice that the grades of all three of those projects on the left side of that bar graph are below 2 grams/tonne (g/t) whereas RMS' Dalgaranga (acquired through Spartan; the 4th column) has much higher grades of gold at 5.6 g/t, and is also more advanced and there's been more drilling done at Dalgaranga, and more recently too [I also hold RMS shares]. Focus Minerals have been focused on their Coolgardie assets for some time and their Laverton assets that they recently sold to Genesis hadn't had much work done on them for a few years. Genesis intend to rectify that and show those Laverton assets some love again now with plenty of additional drilling planned.
But that's not all that Genesis Minerals have going on. The map below shows most of their assets, but not all, because they have some gold projects down near Kalgoorlie as well (to the south of the map below) that they call their Bardoc assets which includes two major gold projects Zoroastrian and Aphrodite, very close to where Gorilla Gold (GG8) are drilling out their Comet Vale project and finding very good grades of gold. Genesis (GMD) own 7.37% of GG8 through selling GG8 the Mulwarrie project (a little west of Comet Vale) back in November 2024.
Mulwarrie was owned by Spitfire Materials Limited who merged with Excelsior Gold to create Bardoc Gold in 2018. Ownership of Mulwarrie then transferred to St Barbara Limited (SBM) in 2022 as part of St Barbara’s acquisition of the Bardoc Gold Project. Genesis (GMD) subsequently acquired St Barbara’s Leonora and Bardoc assets, including Mulwarrie, in 2023, and sold Mulwarrie to GG8 (then known as Labyrinth Resources) in late 2024, and as proceeds from that sale Genesis received upfront consideration (from Labyrinth, now Gorilla Gold) of $3.75 million, through the issue of approximately 17.86 million fully-paid Labyrinth shares, plus Genesis is entitled to a cash milestone payment of $1m on the achievement of first commercial production from the Mulwarrie tenements. [Source: https://www.listcorp.com/asx/gg8/gorilla-gold-mines-ltd/news/acquisition-of-mulwarrie-from-genesis-minerals-3116958.html]
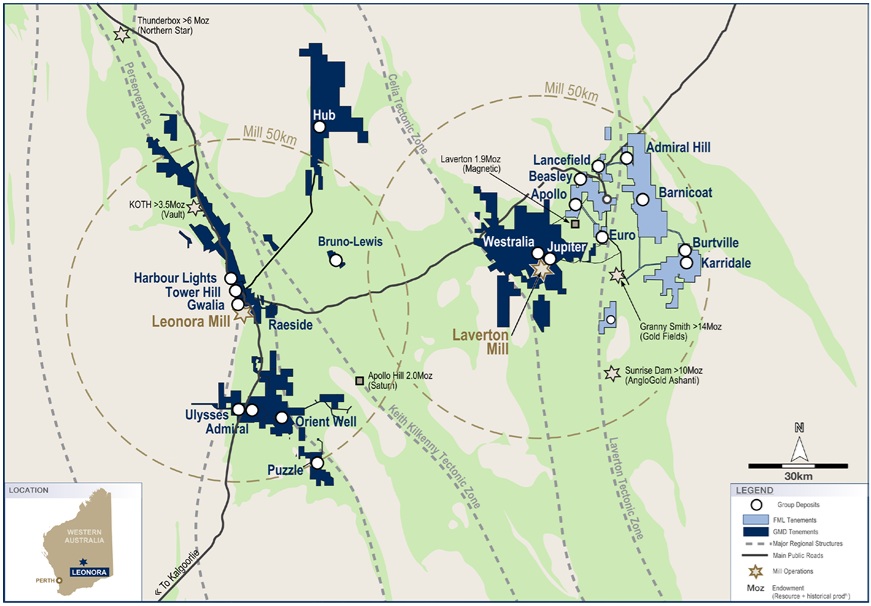
So that's the main Genesis assets in the dark blue and the light blue (the light blue ones are the tenements they bought from Focus/FML recently) and they also have those Bardoc gold assets further south of that map towards Kalgoorlie (including Zoroastrian and Aphrodite).
But getting back to your original question @Stevie_B - here is a chart from the World Gold Council that they published on March 7th this year in an article titled: "Ever upwards for AISC, but distinct regional variations are emerging" - and here's a link to that article: https://www.gold.org/goldhub/gold-focus/2025/03/ever-upwards-aisc-distinct-regional-variations-are-emerging
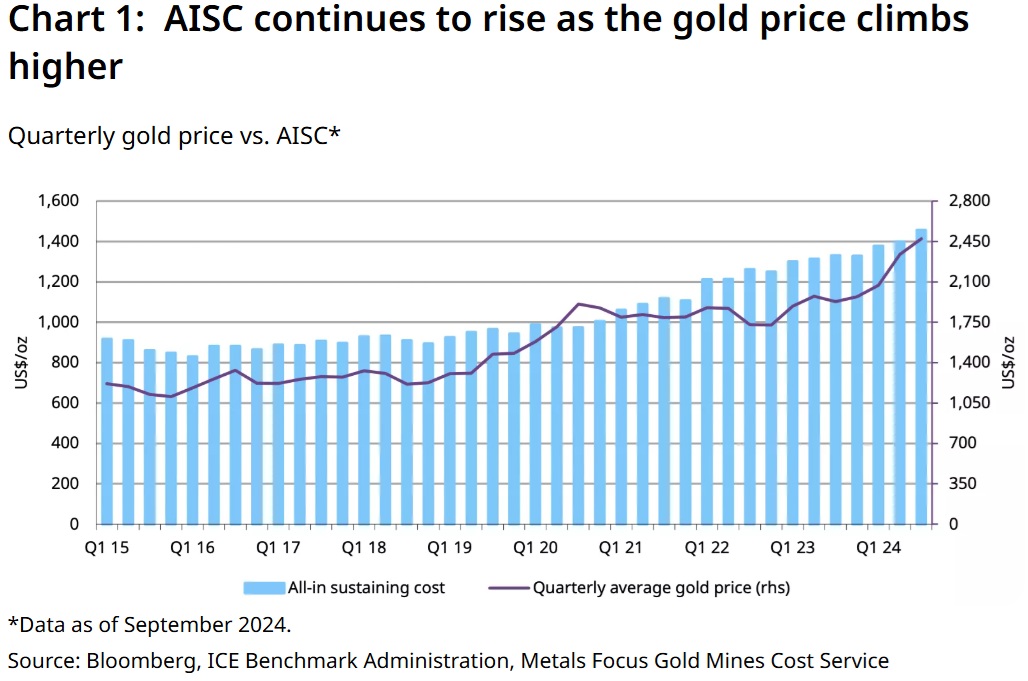
That chart only goes up to Q3 of calendar year 2024 despite being published in March 2025, and the prices there are all in US$, not Australian dollars, but what it demonstrates are that cost are rising across the gold industry globally, so what probably matter most is what each company's margins are, being the difference between the price a company sells its gold for and the costs of producing that gold, which I prefer to think of in "cost per ounce of gold produced" terms. AISC is also on that same basis of per ounce of gold produced of course, but it's not so much the costs that matter but the profit margin the company is making which is basically the difference between gold sales and costs. And in those terms, Genesis' margins are very good, as demonstrated by their free cash flow production back at the top of this post.
Here's the second chart from that same article that shows how AISC has been rising in different regions of the world, accurate as at September 2024, so almost a year out of date now:
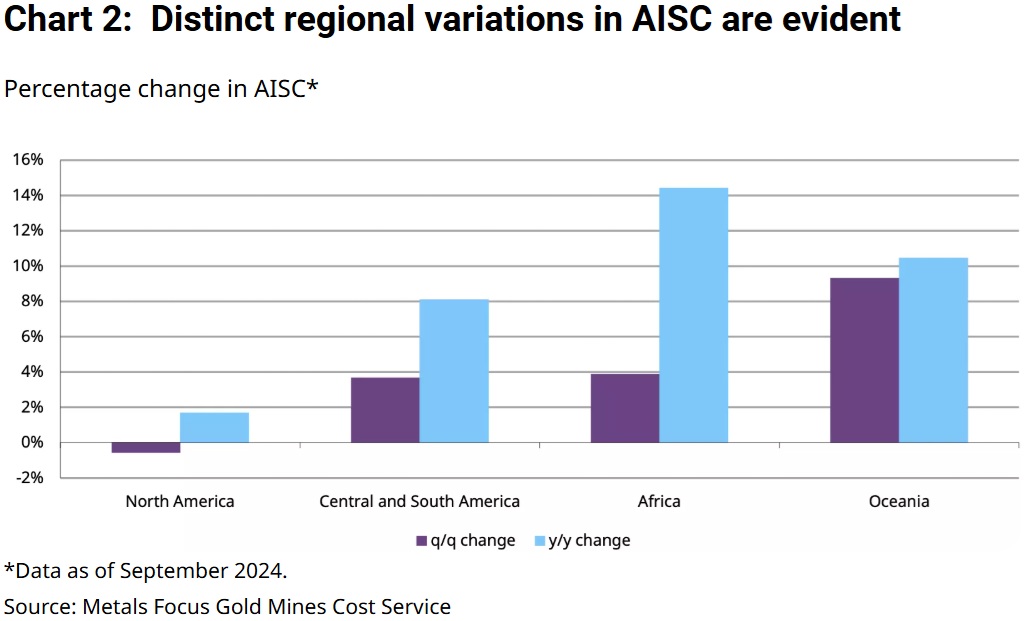
So increasing costs are something to be aware of, however back to comparisions between GMD and their peers: Not only do Genesis Minerals (GMD) have good margins and excellent cash flow, they are also growing production at a good clip as well. And their costs compare favourably with many of the largest gold miners in the world.
If you want to compare GMD's AISC with the world's largest gold miners, who are much larger than Genesis are, the following chart shows the AISC of the world's largest gold miners in Q1 of calendar 2025 - so the quarter ended 30 March 2025:
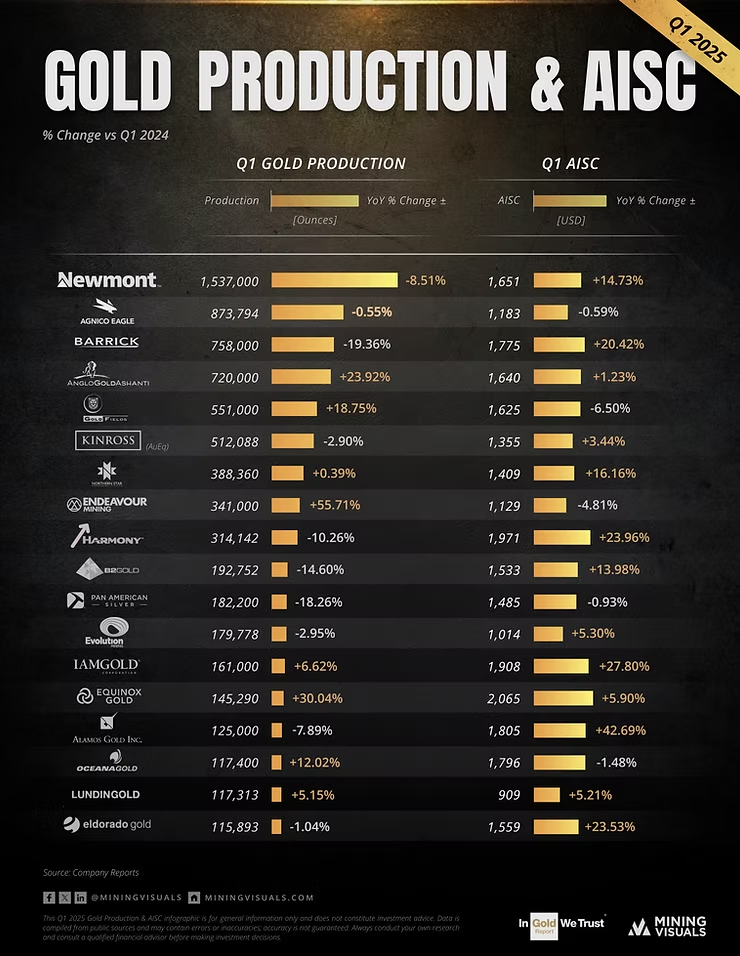
Only two of those are Australian gold miners, Northern Star (NST) at #7 and Evolution Mining (EVN) at #12, and their AISC was US$1,409/ounce and US$1,014/ounce respectively according to Mining Visuals.com - here's the link to that: https://www.miningvisuals.com/post/gold-production-aisc-q1-2025
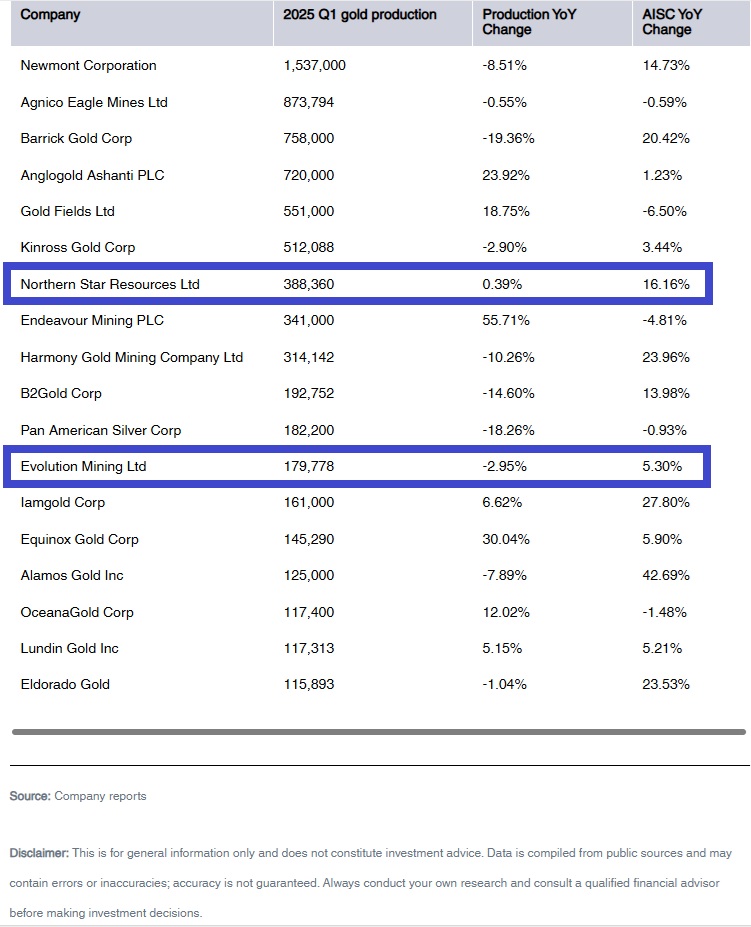
Here's another table from that same article of theirs that shows whether each company is producing more or less gold, and has higher or lower costs, compared to Q1 of last year (so Year on Year - YoY - comparisons) - it's the same data as in the chart above, but in a table format and does not include the actual AISC numbers which are included above.
For comparison, for that same Quarter (Q1 of calendar 2025), Genesis (GMD) reported record quarterly gold production of 59,767oz with an AISC of A$2,323/oz (source: page 1 of GMD-Quarterly-Activities-Report---March-2025.PDF) which is US$1,459/oz based on the exchange rate at 31st March 2025 (calculation source: https://wise.com/au/currency-converter/aud-to-usd-rate/history/31-03-2025), so GMD's AISC was lower than the world's largest gold miner, Newmont (US$1,651/oz) and the world's third largest gold miner Barrick (US$1,775/oz) and the next two as well (Anglogold Ashanti and Gold Fields).
Out of the top Five gold miners in the world, in terms of gold produced in Quarter 1 of Calendar 2025, only one of them, Agnico Eagle (at #2), who are probably the best non-Aussie gold mining company (IMO), had lower costs in Q1 of this calendar year than Genesis Minerals (GMD).
Of the two Australian goldies in that list above, NST's AISC was a little lower than GMD's @ US$1,409/oz and EVN's AISC was much lower at US$1,014/oz, but Evolution use copper production to generate byproduct credits which reduce their AISC for gold production so not all of their gold mines are low cost mines and the copper byproduct credits distort their real gold production costs (Evolution produce a lot of copper). To put it another way, EVN's Group AISC does not provide a good reflection of their costs at each of their gold mines - most of their mines have signficantly higher costs and two of their mines have negative AISC because of those copper byproduct credits, which brings their Group AISC right down, so I usually ignore EVN when looking at AISC comparisons because of their copper production and how it affects their gold production costs.
So, what all this proves to me is that Genesis (GMD) is punching above their weight in terms of lower costs compared to many/most of their peers both here and globally, as well as having superior cash generation, and growth, and I'm including much larger companies in those comparisions, something Genesis themselves don't tend to do in their own presentations.
In terms of GMD's "current cost to mine (AISC)" apparently being approximately A$2,499 per ounce, that converts to US$1,627/oz today.
And here are the current gold prices:
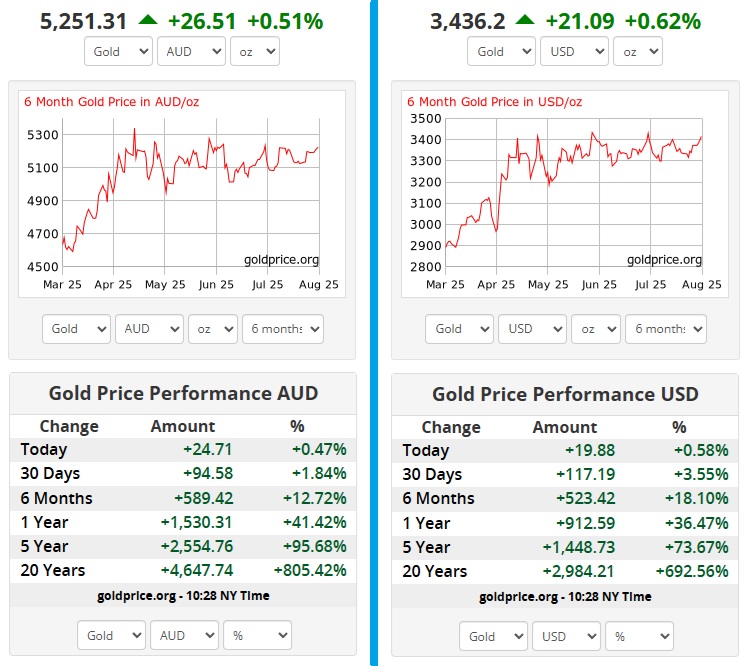
Source: https://goldprice.org/ [A$ gold prices on the left and US$ gold prices on the right]
Yeah, so like all well managed gold producing companies in Australia right now with low-to-reasonable costs, they're killing it!
And they are one of the best growth stories in the Aussie gold sector too, which is why they don't pay dividends yet - all of that cash they are producing is being plowed back into developing their assets or else is being added to their net cash stockpile to pay for future capex.
Hope that helps.
Disclosure: Of the goldies I've discussed in this particular post, I hold GMD, NST, EVN and RMS, plus a few others that appear on some of those comparison tables / charts, plus a few more smaller gold explorers, project developers and emerging producers, so I'm clearly a gold bull.


