Forum Topics NAN NAN FY23 Result

Pinned straw:

Added one year ago

Nanosonic released FY23 results this morning.

Revenue:

ebcc305d2aa0ccfefd8ee9863899c525bfd08d.png

Customer Receipts


b4c2613422951d101b8c3cdcce2ca58a86c75f.png

Expense

ac2ec125842ec301dbcd85d90c6b18b2e6bd4a.png

Operating Cash

e4e514221332e98c8b15ecec9a66ded17bd655.png


New Installed Base declined by 16%

8619bee1329276e549140e6e854c597bb1ffd0.png


Coris delayed (again)

4499b8e80ed65fcd77d99ab7f213bf9c823fbc.png

Valueinvestor0909
Added one year ago

Nanosonic Revenue vs Share Price chart.

This Year's result wasn't bad if you look at the revenue growth or Gross margin or profit etc.

5694dbd4d0dcedb97b0c0a350ba95f524c49cc.png


I can only guess that the market didn't like the decline in total new trophon2 install ( not upgrade) or the delay in Coris.


20

Strawman
Added one year ago

I remember when Nanosonics was one of the most heavily shorted stocks on the ASX:
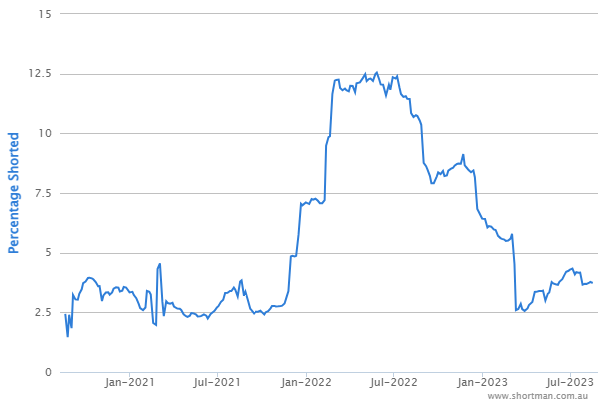
3c1b4a9c7e0cbd102d13ea1bf3b441e8155a97.png

Between March and September last year, over 10% of shares outstanding were shorted (average price over that period was about $4, and for 90% of the time it was below the current price).

My best guess was that these were valuation based short positions -- after all, the business had more cash than a small nation, no debt and surging revenue. It was a dumb bet that this thing was every likely to be insolvent anytime soon!

And, sure, 10x sales (or thereabouts) wasn't exactly cheap. But here we are a year later and we've got another strong uplift in sales (38% higher) and record pre-tax and free cash flow. I'm not sure shares are exactly cheap, but it was a real head scratch to see it so heavily shorted.

My only point, i guess, is that Shorters seem to get far more credibility than they deserve. And if you're going to do it, at least bet on business failures and not on valuation grounds -- remember, the market can remain irrational longer than you can stay solvent!

34

RhinoInvestor
Added one year ago

@Valueinvestor0909 thats a nice chart when you zoom out … I’m guessing its something in the vicinity of 20% CAGR in revenue if my public holiday AM mental arithmetic holds.

Roughly 4x revenue and 2x share price over the period tells me that relatively speaking it’s on special at the moment albeit as @Strawman pointed out, there have been some market shenanigans impacting things in the past. I think their razor and blade business model is still working (high 70’s Gross Profit) and with a little bit of patience for the next-gen razor (CORIS) will should be rewarded.

DISC: Held IRL and Strawman

DISC#2: If I didn’t have my money invested, I’d probably spend it on something unnecessary so happy to keep riding this position.

19

Valueinvestor0909
Added one year ago

Interesting slide from the Nanosonics AGM presentation, which corresponds to what I was trying in the above graph of Share price vs Revenue over the years.


How the company has evolved from 30th June 2019 to 30 June 2023

3776a72b7e6e2b0c361b2155047dbc71482b10.png


How market has reacted for the same period ( 30th June 2019 to 30th June 2023)

f25e5eb0aed9944eae605ccbdc31c6ef83a14c.png

20

Mujo
Added one year ago

The rate environment is of course different from 2019/20 - but the business has definitely executed.


5875468f14ecd98d928fbd2f6becd66554b4ee.png

16

AUROPAL
Added one year ago

I know they say the market is a weighing machine over the long term but "long term" must be longer than 5 years in this market!

Although I do note that there is no EPS or profit comparison in the above graphic.

15

thunderhead
Added one year ago

Yes. The repeated delays with commercialising CORIS haven't helped either.

The valuation is pretty full in any case, even now.

13