


Price History
Premium Content
Premium Content
Premium Content
I’m setting out my valuation of $CAT here, which I’ve been working on since the FY results were announced.
I’m not going to go back over the results or over my investment thesis, but definitely read @Strawman s “Bull Case” straw of three weeks ago (for the thesis) and the FY25 Results Forum Topic initiated by @BendigoInvesto, and the forum post by @Valueinvestor0909 (his Arichlife article) for some great analysis of the results.
I also recommend watching last week's video discussion between Claude Walker and @Strawman. Some really great insights here, and I found myself nodding furiously to most of it while cooking dinner last night.
In this valuation, I explore some of the key value drivers and sensitivities. My conclusion is that, despite $CAT’s tremendous SP progression (up around 60% YTD 2025), there remains significant upside potential that is not yet recognised by the market.
My overall view, is that in this particular race, $CAT has a long way to run and that it can comfortably keep delivering 15-20% annual returns from here for the foreseeable future. I would see any significant pullback from today’s price as a buying opportunity.
Valuation
My first detailed view on valuation is A$5.50 (A$4.50 - A$6.50). However, I must stress that this does not recognise the significant upside potential that may exist within the business today, and I point to some of this later in this straw.
The chart below captures my analysis, and I will explain what each of the elements means in the remainder of this straw. I'm sorry it is so complicated, but I will step through it.
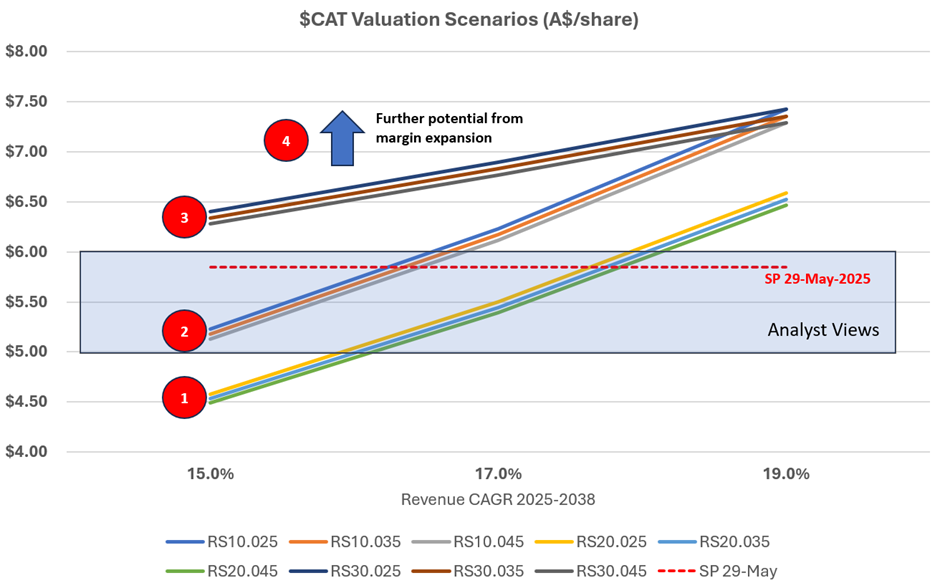
The easy bits to see are Friday’s closing price (A$5.85) and the range of analyst views (www.marketscreener.com; n=6) of $5-$6.
An important motivation for me to do this analysis is to properly understand the upside potential in this business. It is clear the market has reacted positively, and the business is gaining increasing analyst coverage. I felt I wanted to have a point of view on risk/reward around the SP, partly to temper any tendency to take some profits if the SP continues to appreciate.
Another prompt is @Strawman's valuation of A$3.51, which is a simple calculation which asks: how long does it take $CAT to get to Will’s US1bn revenue at his target margin structure, and what would such a business be worth today, using an EBITDA multiple? I replicated a similar analysis (getting a similar number). My main concern with that valuation, is that at the terminal point, the business is still growing FCF at 19% annually, so an EV/EBITDA multiple of 12 seems low. Using multiples of 15 and 20 yields SP’s of $4.35 and $5.22, respectively, using similar assumptions to @Strawman .
Conclusion for My Investment Decisions
What emerges from my analysis detailed below is a view that:
- Should the SP fall back towards my lower range of A$4.50, I would be willing to add more to my existing 8% RL ASX holding.
- I won’t countenance selling in the short term at anything less that $7.00.
To unpack the analysis leading to the above chart, I’ve structured this straw as follows:
1. Approach of Valuation
2. Revenue Growth Scenarios
3. Margin Evolution Scenarios
4. Impact of Share Based Compensation
5. Discussion of Valuation Results (Referring to the Graph)
6. Further Upsides Not Quantified
7. Risks and When I’d Sell
8. Other Assumptions Used
1. Approach to Valuation
CEO Will Lopes have given us a nice framework for valuation.
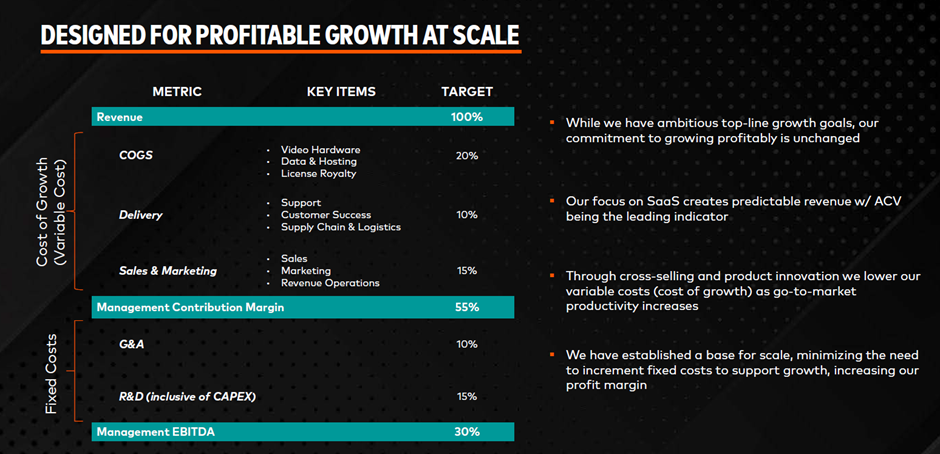
Basically, what he calls “Management EBITDA” is simply Free Cashflow before Interest and Tax.
This has then enabled me to run a simple DCF where I have the starting point of FY25 and simply then have to make four assumptions:
1. By what year are the target margin ratios achieved?
2. How do margins evolve from today until the target ratios are achieved?
3. What is the revenue growth each year?
4. What is the rate of ongoing dilution due to share based compensation?
Of course, there are all the other assumptions that needed for a DCF, which I list at the end of this straw.
In line with @Strawman’s valuation, I run the DCF out to 2038, as this is notionally the period over which $CAT can grow strongly to achieve the ballpark $1bn revenue.
2. Revenue Growth
Total revenue growth in the last two years has been 18.5% and 16.5%, however the key value driver has been subscription growth, which has been higher, and there has also been the current headwind of a strengthening US dollar. As @Strawman points out, growing at 20% CAGR means it will take c. 13 years to hit $1bn revenue.
As @jcmleng picked out of the recent Livewire interview, Will has said he aims to get current ACV of $26-$27k per team up to $100-$150k, driven largely off product enhancements currently in development, and continuing to get more teams onto multiple products. In this interview he made clear that this won’t just be the preserve of the top elite pro teams, but that the capabilities in the platform will enable less well-off pro teams to make more productive use of their staff. So $CAT is to the coaching and fitness staff of a pro sports team what Cargowise at $WTC is to workers in a logistics firm, or $XRO to an accountancy practice. The software does more of the repetitive tasks, freeing staff up for higher value staff or allowing an operation to run a leaner crew. This cost saving agenda for clubs is in addition to helping them manage the players better, which is likely a much bigger prize.
This is going to be really important to drive the adoption of $CAT in pro sports teams. For the richest teams with budgets of $100m to $500m p.a., the spend on $CAT is peanuts. Once it is embedded in their workflows, the pricing power will be strong. However, in smaller clubs, with budgets of a few millions, investing in $CAT will be carefully justified. So running with a support staff of 6-8 instead of 8-10 is what will be needed to justify Will's vision of a broad capture of $100-$150k ACV deep into the subscriber base. It seems plausible.
So what's the revenue runway?
There are 3x-4x in the number of teams ahead of it, 4x-5x of multi-vertical conversion ahead, and with further enhancements drived by ongoing R&D spend at a solid 15% of revenue, ongoing, it does not take a leap of faith to believe that $CAT can grow strongly for many years to come. 10x to 15x in revenue seems very plausible.
In fact, in the early years, given the money going into pro sports, the strong growth of video in T&C, and the availability of Vector 8 which offers many improvements, there is every chance we could see revenue growth start to accelerate from the 18%-20% of where we currently are.
So this then leads me to my revenue growth scenarios for the next 14 years:
Within the series of curves on the graphs shown above, in Red Circles 1 and 2, I simply assume constant, annual revenue growth rates of 15%, 17% and 19% from 2026 out to 2038.
But growth won’t be linear, so in the Red Circle 3 lines, I’ve assumed revenue growth starts at today’s c. 19% p.a. and then exponentially decays each year to reach the values on the horizontal axis, i.e., 19% (no change), 17% and 15%. So the Red Circle 3 lines represent the upside to valuation that revenue growth stays "stronger for longer".
3. Margin Evolution
I’m comfortable with Will’s proposed target margin structure shown above, simply because of the track record over the last few years.
But what made me sit up and take notice in the FY results call, was Will’s statement that he believes $CAT can get to this structure by the time revenue hits $200m.
What!? That’s not FY39 but FY29. Wow. Of course we don’t know when that margin structure will be achieved, but it is a very important valuation parameter.
So, in the curves shown by Red Circle 1, I’ve assumed that the target margin structure is achieve in FY38, and that between FY25 and FY38 the gap between the current margin structure and the target closes linearly.
But, Will believes they’ll get there much earlier. And this is consistent with the current trajectory. Therefore the curves shown by Red Circles 2 and 3, assume the gap to the target margin structure is closed progressively between FY25 and FY29. Thereafter I’ve assumed the target margin structure is maintained. (I’ll come back to this later.)
So, now we can see across the three groups of lines how revenue growth and margin evolution drive valuation.
4. Share Based Compensation
I’ve done a deep dive to understand the impact of share-based compensation. It is tedious, but important. In the last three years, SOI have increased by 6.9%(FY23), 6.2%(FY24) and 2.7%(FY25). However, there are some important factors to be considered.
First, in FY23 and FY25 parts of the increase in shares was due to the earnout of the SBG Sports Software acquisition. And in FY24, when the SP was in the toilet, the Board seemed to double-dip, offering a second round of compensation, presumably because retention was at risk as staff shares were worth not very much and options were being cancelled.
So, with this understanding in mind, I’ve run scenarios for ongoing share-based compensation levels of 2.5%, 3.5%, and 4.5%. And that explains why for each set of curves, there are three closely stacked curves. The impact of dilution across this range has a SP impact of around A$0.10 at the lowest valuations up to A$0.15 at the highest.
5. Discussion of the Valuation
The above sections explain all the variables plotted in the chart above.
In choosing my valuation range of A$4.50 - A$6.50 I have been conservative. I believe that the target margin structure will be achieved over the next 4-5 years. And I also believe that revenue growth will be more in the range of 17%-21% p.a. over the next 5 years. Taken together, these will result in upwards revisions to my valuations over time, and the analysis presented gives an indication of the scale of sensitivity.
6. Further Upsides
I am going to explore some further upsides, not included in the model.
6.1 Revenue
Will has established a disciplined resource allocation model that appears to be driving c. 20% annual subscription growth, without pulling the pricing lever. I think that’s the right strategy – driving innovation to maintain the product’s industry leading position, and encouraging more and more of the target market to adopt, all-the-while achieving strong growth in free cash flow.
There are three potential future revenue opportunities:
· Providing more services to broadcasters to enhance viewer experience
· Leveraging the vast database of player data and enhancing predictive analytics
· Connecting third party devices and services into the platform.
And, as I explain at the end, my DCF Continuing Value growth rate in 2039 is 3.0%. Obviously, if $CAT is still growing revenue at 15%, 17% or 19% in 2029, then this is a conservative assumption.
I’ve not modelled any of these revenue upsides.
6.2 Margin
In my modelling I’ve assumed Will can hit the target margin structure and that when he does, the business stays there into the future. So, this is worth a deeper dive.
First Gross Margin. The target %GM of 80% has already been exceeded in the last two years. And with the transition to subscription now complete, and the focus firmly on software rather than hardware development, it seems entirely plausible that as the business scales, higher %GMs will be achieved. It doesn’t seem a leap of faith to consider that a $1bn revenue $CAT could have a %GM of 85%. One to keep an eye on over time.
“Delivery” and “S&M” will probably scale proportionately as the business scales. A target spend of 15% for S&M is comparable with Microsoft (c.12%) and Oracle (16%). Firms in more competitive markets can spend a lot more - Salesforce (33%), Intuit (27%) Adobe (30%). As $CAT scales to $1bn revenue, its reputation in the sector will be well and truly cemented, and so a relatively low 15% S&M spend sounds reasonable.
Equally, spending 15% on R&D is both wise and appropriate. For $CAT to maintain its industry-leading position, it will need to innovate continuously. I see only downside risk to scaling back on innovation.
A final upside is G&A. Here 10% has been assumed. As the business scales, provided it retains a clear focus on pro sports, its should be possible to retain a focused overhead structure. Upsides to 6% to 8% are conceivable.
In conclusion, considering both Gross Margin and G&A opportunities, it is conceivable that $CAT could expand its “Management EBITDA Margin” from 30% to 35%.
Again, I’ve not included this upside in today’s valuation. But it is one to bear in mind over the coming years.
7. Risks and When I’d Sell
Competition & Innovation
The global pro sports industry is vast and is attracting a lot of capital and technological innovation. While $CAT has a clear lead over its much small and less developed rival Statsports, it is worth keeping an eye on the competitive playing field. Of course, the industry is so large that there is room for multiple players. As importantly, is the need for $CAT to innovate, and bring more and more capabilities and features of value to its customers. Maintaining a consistent watch on both its innovation progress and the competition is key.
Management
The more I get to hear Will the more I am impressed with his leadership. Few businesses put out such an explicit, value-based, economic framework against which progress can be tracked. As far as I am concerned, $CAT has no need to offer guidance. They simply have to explain their results in the context of progress against this framework – and this includes periods when progress won’t be linear. I think it is easy to under-estimate the value that Will has personally brought to this business over the last few years. I don’t yet see this as a business that any professional manager can run, and I’d be very concerned if Will were to leave. It would be good to understand more about the bench below him.
Customers
It is important to see $CAT firing on all dimensions of customer value: low churn, increase multi-verticals %, new customer adds, rising ARPU. While growth won’t always be linear, I’d become concerned if during two consecutive years revenue growth fell back to 15%.
8. Other Assumptions Used
All values are $US unless states as $A.
Discount rate: 10%
Tax Rate: 30%
Capital Structure: No LT Debt; net finance cost of 2% of (Variable Costs + Fixed Costs)
AUD:USD: 0.65
CV Growth rate: 3.0%
Disc: Held in RL and SM
I know this isn't directly relevant to $CAT on face value, however, we are continuing to see valuations of sports team climb ever higher. (See latest record deal below).
This is part of my thesis for $CAT. Sports leagues, media companies, tech companies are continuing a dance of deals that, at its heart, has capturing the eyeballs of the global viewing public and monetising that. Realising that value will involve investment in a range of enabling technologies, including those in which $CAT is a market leader.
With $CAT reporting in a couple of months, I will be listening carefully to understand to what extent Will's innovation priorities and prgress are aligning with this strong industry tailwind.
Of special interest, will be the continued progress of video, leveraging the SBG acquisition, and the technology many of us will have seen at play during the recent Australian F1 Grand Prix. (RaceWatch),
Disc: Held in RL and SM

Sports tech. firm $CAT reported their 1H FY25 results.
My overall assessment - good, steady progress. 1) Good revenue growth 2) Importantly, $CAT achieved incremental profit margin of 75% (which I think is what Will has consistently said the goal is.) and 3) Ongoing innovation, particularly with the sideline video product. Video in T&C is growing very strongly, with strong ACV gains being a leading indicator that this will drive ongoing revenue growth.
Their Highlights
• Annualized Contract Value (ACV), Catapult’s leading indicator of future revenue, grew 20% on a constant currency (CC) basis year-on-year (YoY) reaching US$96.8M (A$143M)
• Revenue increased to US$57.8M (A$85M), +19% (CC) YoY
• The profit margin on the incremental revenue generated reached 75% YoY; delivering Free Cash Flow (FCF) of US$4.8M (A$7M)
Catapult delivered another strong performance from its core SaaS verticals, with ACV growth of 20% (CC) YoY. This reflects the addition of US$10M of incremental ACV half-on-half (HoH), the largest incremental dollar ACV increase in any previous half year period. Catapult’s core SaaS metrics continue to demonstrate the embeddedness of Catapult’s product solutions into team workflows, with:
• ACV Retention consistently strong at 96.2%
• Customer Lifetime Duration increasing 7% YoY to 7.6 years
• Pro Team Customers increasing 7.9% YoY to 3,470 Teams
My Quick Assessment on Cashflows
Continuing good progress. 5th consecutive positive operationing cashflow and 3rd consecutive FCF.
Operating leverage showing through in cash flows: Receipts +21.6% to pcp, Payments +17.4% to pcp, leading to OpCF +34% to pcp.
Investment continues to fall as a % of Revenue.
What's good to see in the chart below is that costs continue to be well-managed, while top-line growth continues. (look at the relative slopes of the dotted blue and orange lines)
$CAT took the opportunity in the period to pay down $6m of debt.

Disc: Held in RL and SM
I'm looking forward to reading other SM reports on $CAT today, as I am focused on other things today and won't make the call, but I've just noticed their headlines:
- Annualized Contract Value (ACV), Catapult’s leading indicator of future revenue, grew 20% on a constant currency (CC) basis year on year (YoY)
- The Company hit a milestone revenue mark of US$100.0M (A$152M), up 20% (CC) YoY
- Profit Margin improved +125% YoY resulting in US$4.6M (A$7M) of Free Cash Flow
My quick calculation of FCF is $2.767m (OpCF $31.703 + InvCF -$27.055 + Leases Repaid -$1.972m), however, I've not checked the change in working capital on this.
And of course, this overlooks the hefty non-cash share based compensation element of $9.7m. Which I think means we are being diluted about 4% each year - correct me if I'm wrong.
All that said, the 6-month view below indicates that $CAT has made the transition to a sustainable business. If they can keep on this track. (Note: H2 receipts is seasonally weaker, but look at the cost control. Can they sustain this?)
I recently dipped my toe back in the water with $CAT in RL and SM. I'm still not convinced, so will have to have a harder look at this when I get the time. The slope of my FCF line is promising, however.
