Company Report
Last edited 4 months ago
PerformanceCommunity EngagementCommunity Endorsement
ranked
#254
Performance
n/a
Followed by
17
Straws
Sort by:
Recent
Content is delayed by one month. Upgrade your membership to unlock all content. Click for membership options.
#Bear Case
stale
Added 8 months ago

Well WBT made it to my target for wave(V) down and broke below its long term trend line. It was interesting also to note that wave(iv) didnt rise to the usual targets. That tells me WBT is in the dog house with the investors until something develops news wise to reboot investor intersest. Im sitting here also watching the recording of the lastest interview with CEO Coby from WBT here on Strawman and he is reinforcing the "it's takes time to come to market" tag line. I have felt this a number of times in my investing experience.

Take Arafure (ARU), recently climbed 78% in 1 day just because the AU gov said it would fund a good portion of their new mine development for Rare earths. Ok thats great but its very early days for that to actually commence, hence the substantial drop back down on the same day.

Question is, how long will it take for WBT to explode. No one knows that. Will it rise from where it is now? maybe, although I dont want to be part of any fluke rises and then get caught when it drop back below my purchase price. I like to wait for the first impulsive move up for wave 1 and then the pull back of wave 2. Once I see how these 2 waves play out then I will determine weather I will enter for the historically most powerful wave, wave 3. good luck all

##Bear Case
stale
Added 9 months ago

Just a quick note on WBT. My technicals on the wbt charts is telling me there is more to drop. So im waiting for confirmation to the upside before I enter.

1d chart

82c1e212606b55e6033869b079b6ef3889c1ac.pngThe last couple of days have been weak after hitting the bottom Yellow Trend line of the major consolidation triangle it has been working in. Also note the separation of the thin white line (current indicator) to the Yellow Line (long term indicator) on my Stochastic indicator. They should be following each other ish and when i see it look like it is in the green circle, then i expect the white to come back to the yellow again, therefore an drop is immanent. By how much? not sure there at the moment.

Remember, always wait for a decent move to the upside for confirmation. If you miss it, no problem, theres always more fish in the sea. Better than being stuck in a falling stock right.

#Bear Case
stale
Added 11 months ago

Updated Charts and thoughts

So we made it to as low as 3.45 recently just below my wave 3 target of 3.51. As wave 3 went lower, this then pulls down wave 4's target shown by the box on this 1h chart. I also have a divergence showing up on my 1h RSI/Stoch indicator and it also hit resistance today, so I'm now looking for the next leg down to begin.

Im now looking @ 3.43 to 3.23 for my next target for the last wave 5 down. Trouble is, we have now formed an ABC pattern within wave 4, which could open the door to drop below my main Yellow Trend Line you can see on my charts. Ill revisit once the next leg down has finished.

Im watching this one ike a hawke as I believe it has loads of potential and there is a lot of hype over it, hece the volatility.

c4676ec6d99030a07686e7d1120bde50b114b7.png

#Bear Case
stale
Last edited 12 months ago

Updated Charts and thoughts

So we have now seen wbt move down (ish) to my wave 3 target (see the small orange numbers down in the larger C wave). It could still drop further below the yellow incline trend line down to 3.51 - 3.60 on this wave 3 down though I am then expecting a jump up to 3.96 - 4.10 for a wave 4 retrace before heading back down to my wave 5 target of 3.37. Wave 4 as a rule can be rather protracted also before starting for the last wave 5 down. As always this is all determined on a lack of positive news coming out for WBT. In saying that it has certainly gone higher than some of my targets as there is a lot of hype around WBT as can be seen when it does a move up, its usually does so with gusto.

This is how my chart looks now

b2f04727e85e006c62450ce16d137a6e1ed233.png


#Bear Case
stale
Added 12 months ago

Further update on WBT charts. While wbt has had some nice 20-30% gains of recent, they havent been highly probable and therefore I haven’t participated in them. I am still seeing negaitive trends with weebit. I now have revised my charts taking into account the most recent price actions and it still points me down. You can see my new target has risen to $3.40 - $3.50. This is especially because we now have a firm wave A and wave B in place. The next wave should be a wave C down (comprising 5 waves) to my target area. In the greater picture we are still in an extended wave IV retrace which is common of wave 4, while still looking for a wave V down to the 1.20 - 2.00 region. Of course this thesis can be broken with substantial good news (invalidating my thoughts).

343db9c450a3dd18283e186f7b090bf2dfd7f7.png

#Bear Case
stale
Added 12 months ago

Quick update. While we have just have had a nice 3 wave structure up recently (which I took no positions in as it was too uncertain for me) breaking out above my consolidation triangle, I believe we will see an imminent reversal down now to my target shown @ around 2.95 so long as it doesn’t break meaningfully above th 4.18 price (recent resistance with top of wave (ii) shown on my charts) . You never know the exact path $ takes but over all the patterns and and targets $ hits tells a lot.

The 3 wave stucture up will now result in 5 waves down to the green taget (approx) with much higher probability. When it gets there I may take a position depending on my indicator etc. Good luck everyone.

8071073a8dc0f3b6145d25ed2ab5c83f7d0172.png

#Bear Case, #Technicals,
stale
Added one year ago

Further to @raymon68 comments about possible short positions with JP morgans recent buy in, I thought I would share my techinical analysis with you all

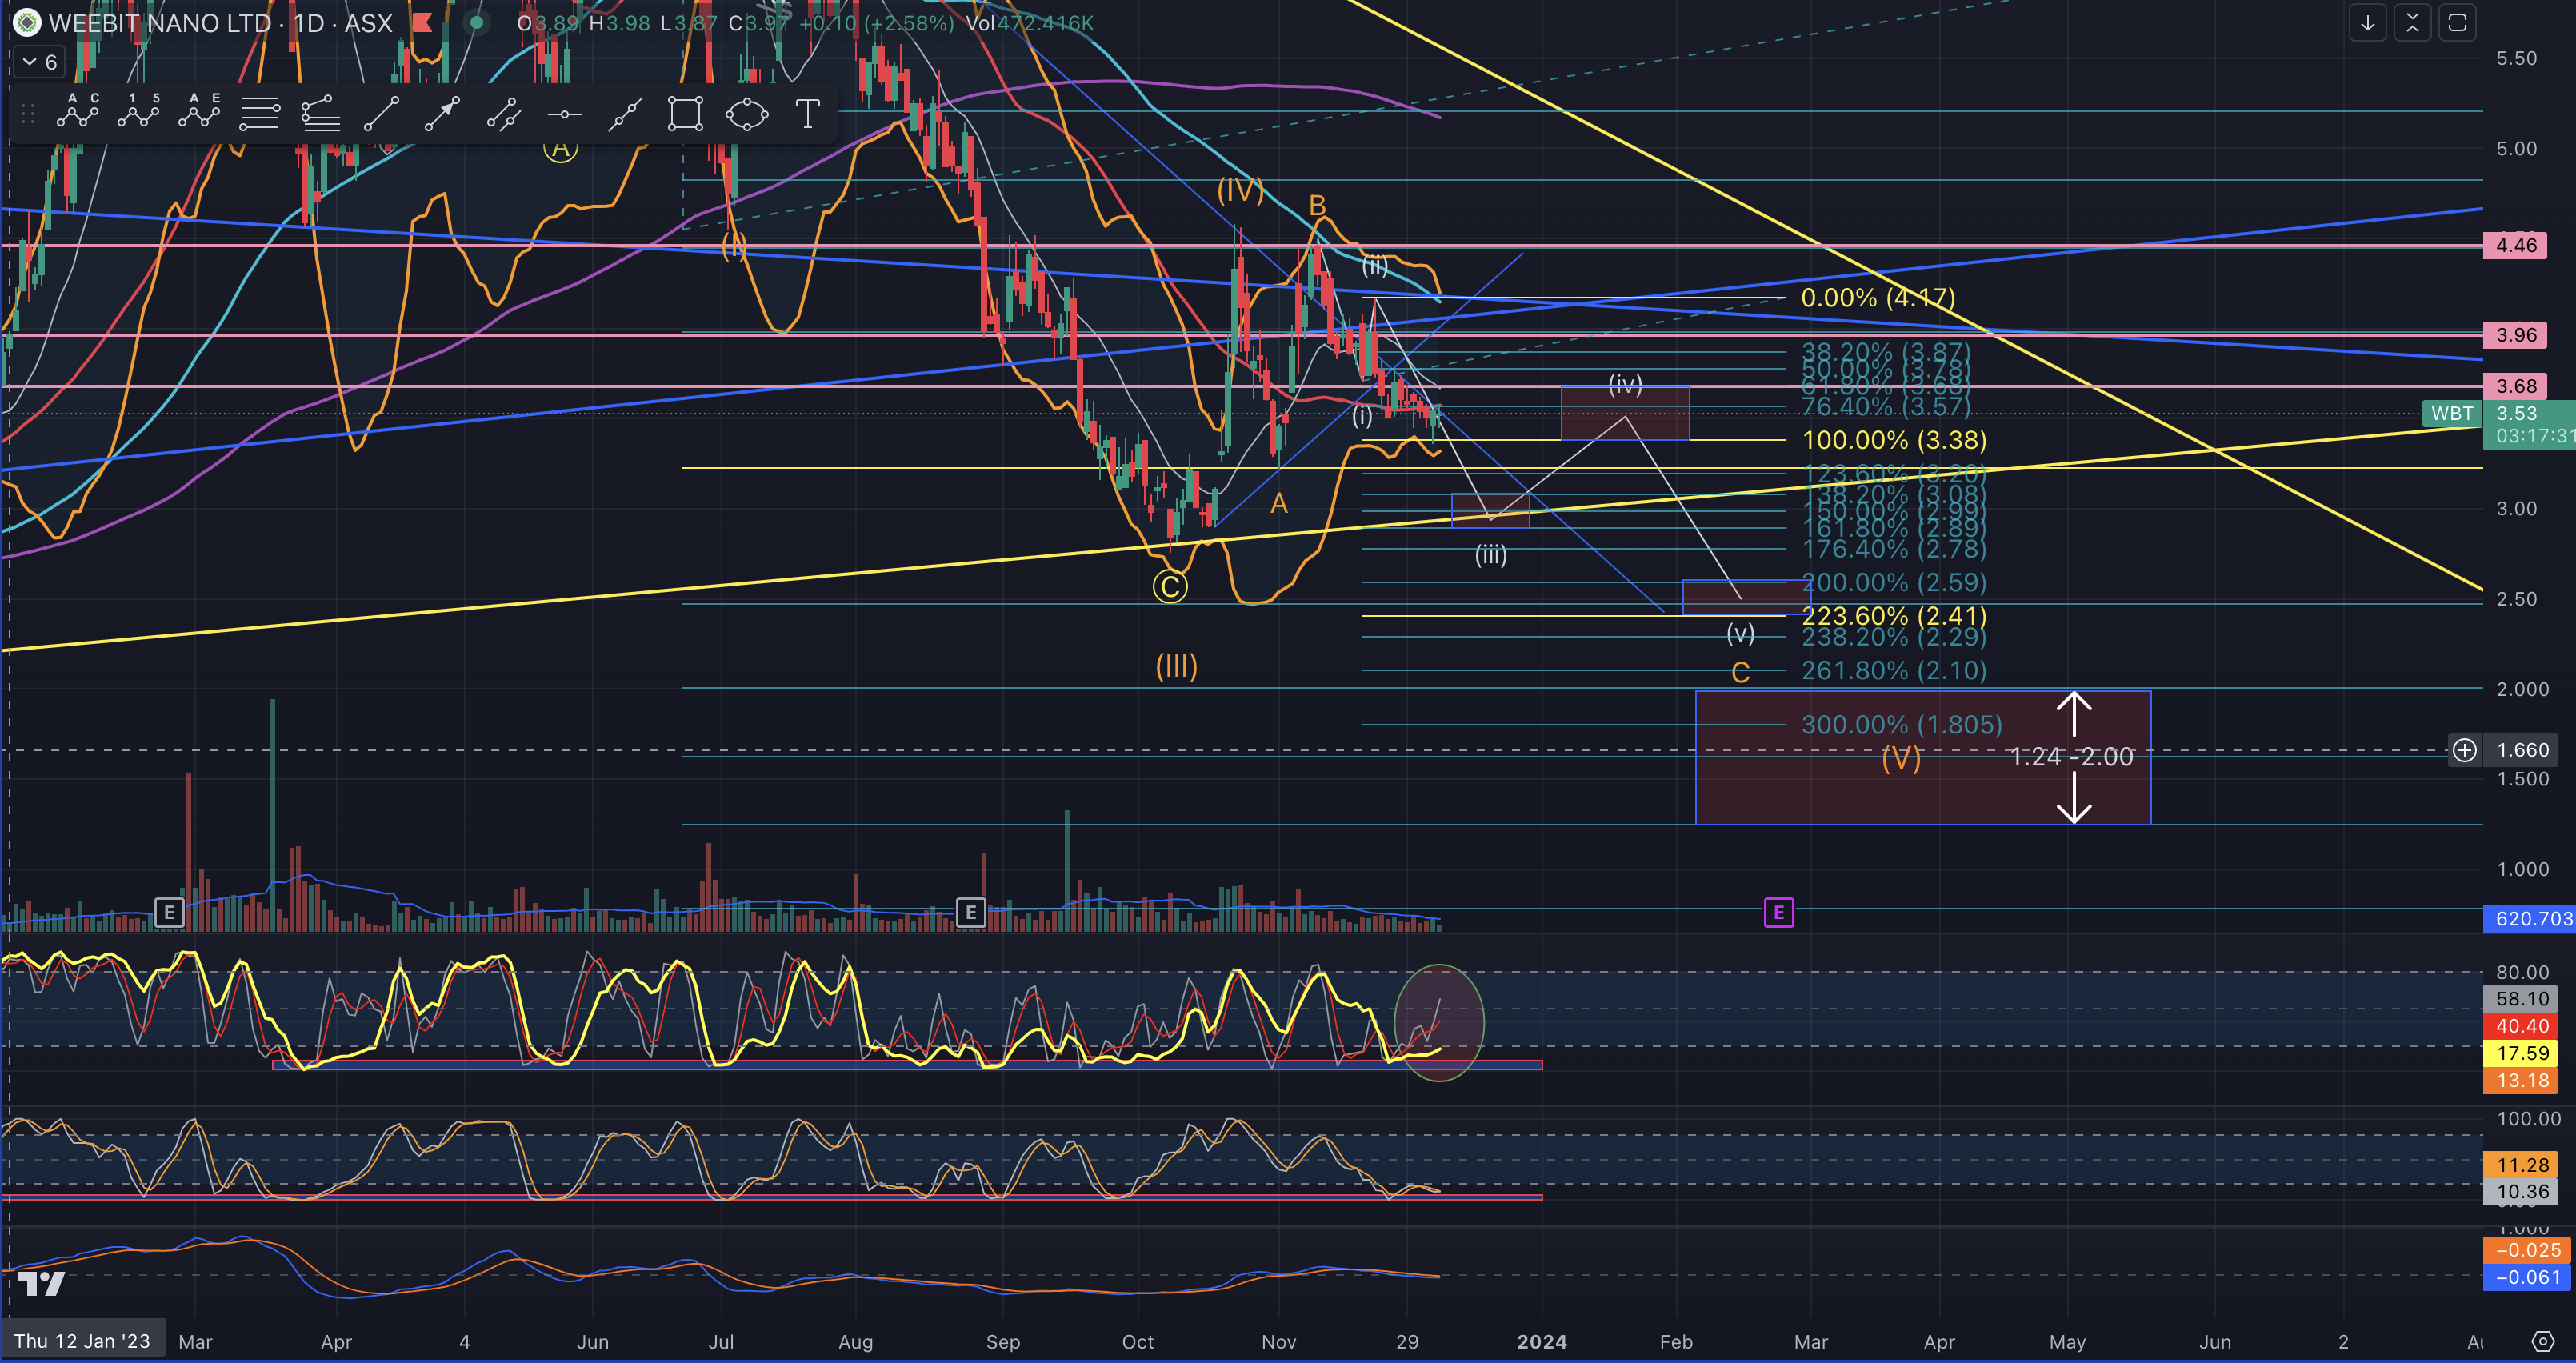
first start on the daily chart
4be25a8510aeb6900d93f25dfa37d678a32b9d.png

This is the approx path (the white zigzag line down) I believe the price of WBT will take without any further substantially positive news being released over the next 2 ish months. Of coarse nothing is perfect so it may vary in time and or price points reached, however it should provide a good guide. I do a lot of chart analysis and this is based on Fibonacci levels that historically provide levels where the population and therefore automatic trading software and high frequency software looks at (obviously because software is written by humans).

You can see WBT is stuck around the 3.58 or 50 sma at the moment although the circled Stochastic indicator below the charts is showing weakness and the RSI/Stoch indicator below that is pointing back down again. Below those 2 indicators is the momentum indicator which is just going sideways also. So im definitely seeing a drop down to the main Yellow trend line below for the (iii) wave down. You can then follow the waves (iv) & (v) in white down from there. To confirm my bearish opinion we now look at the 9day chart below
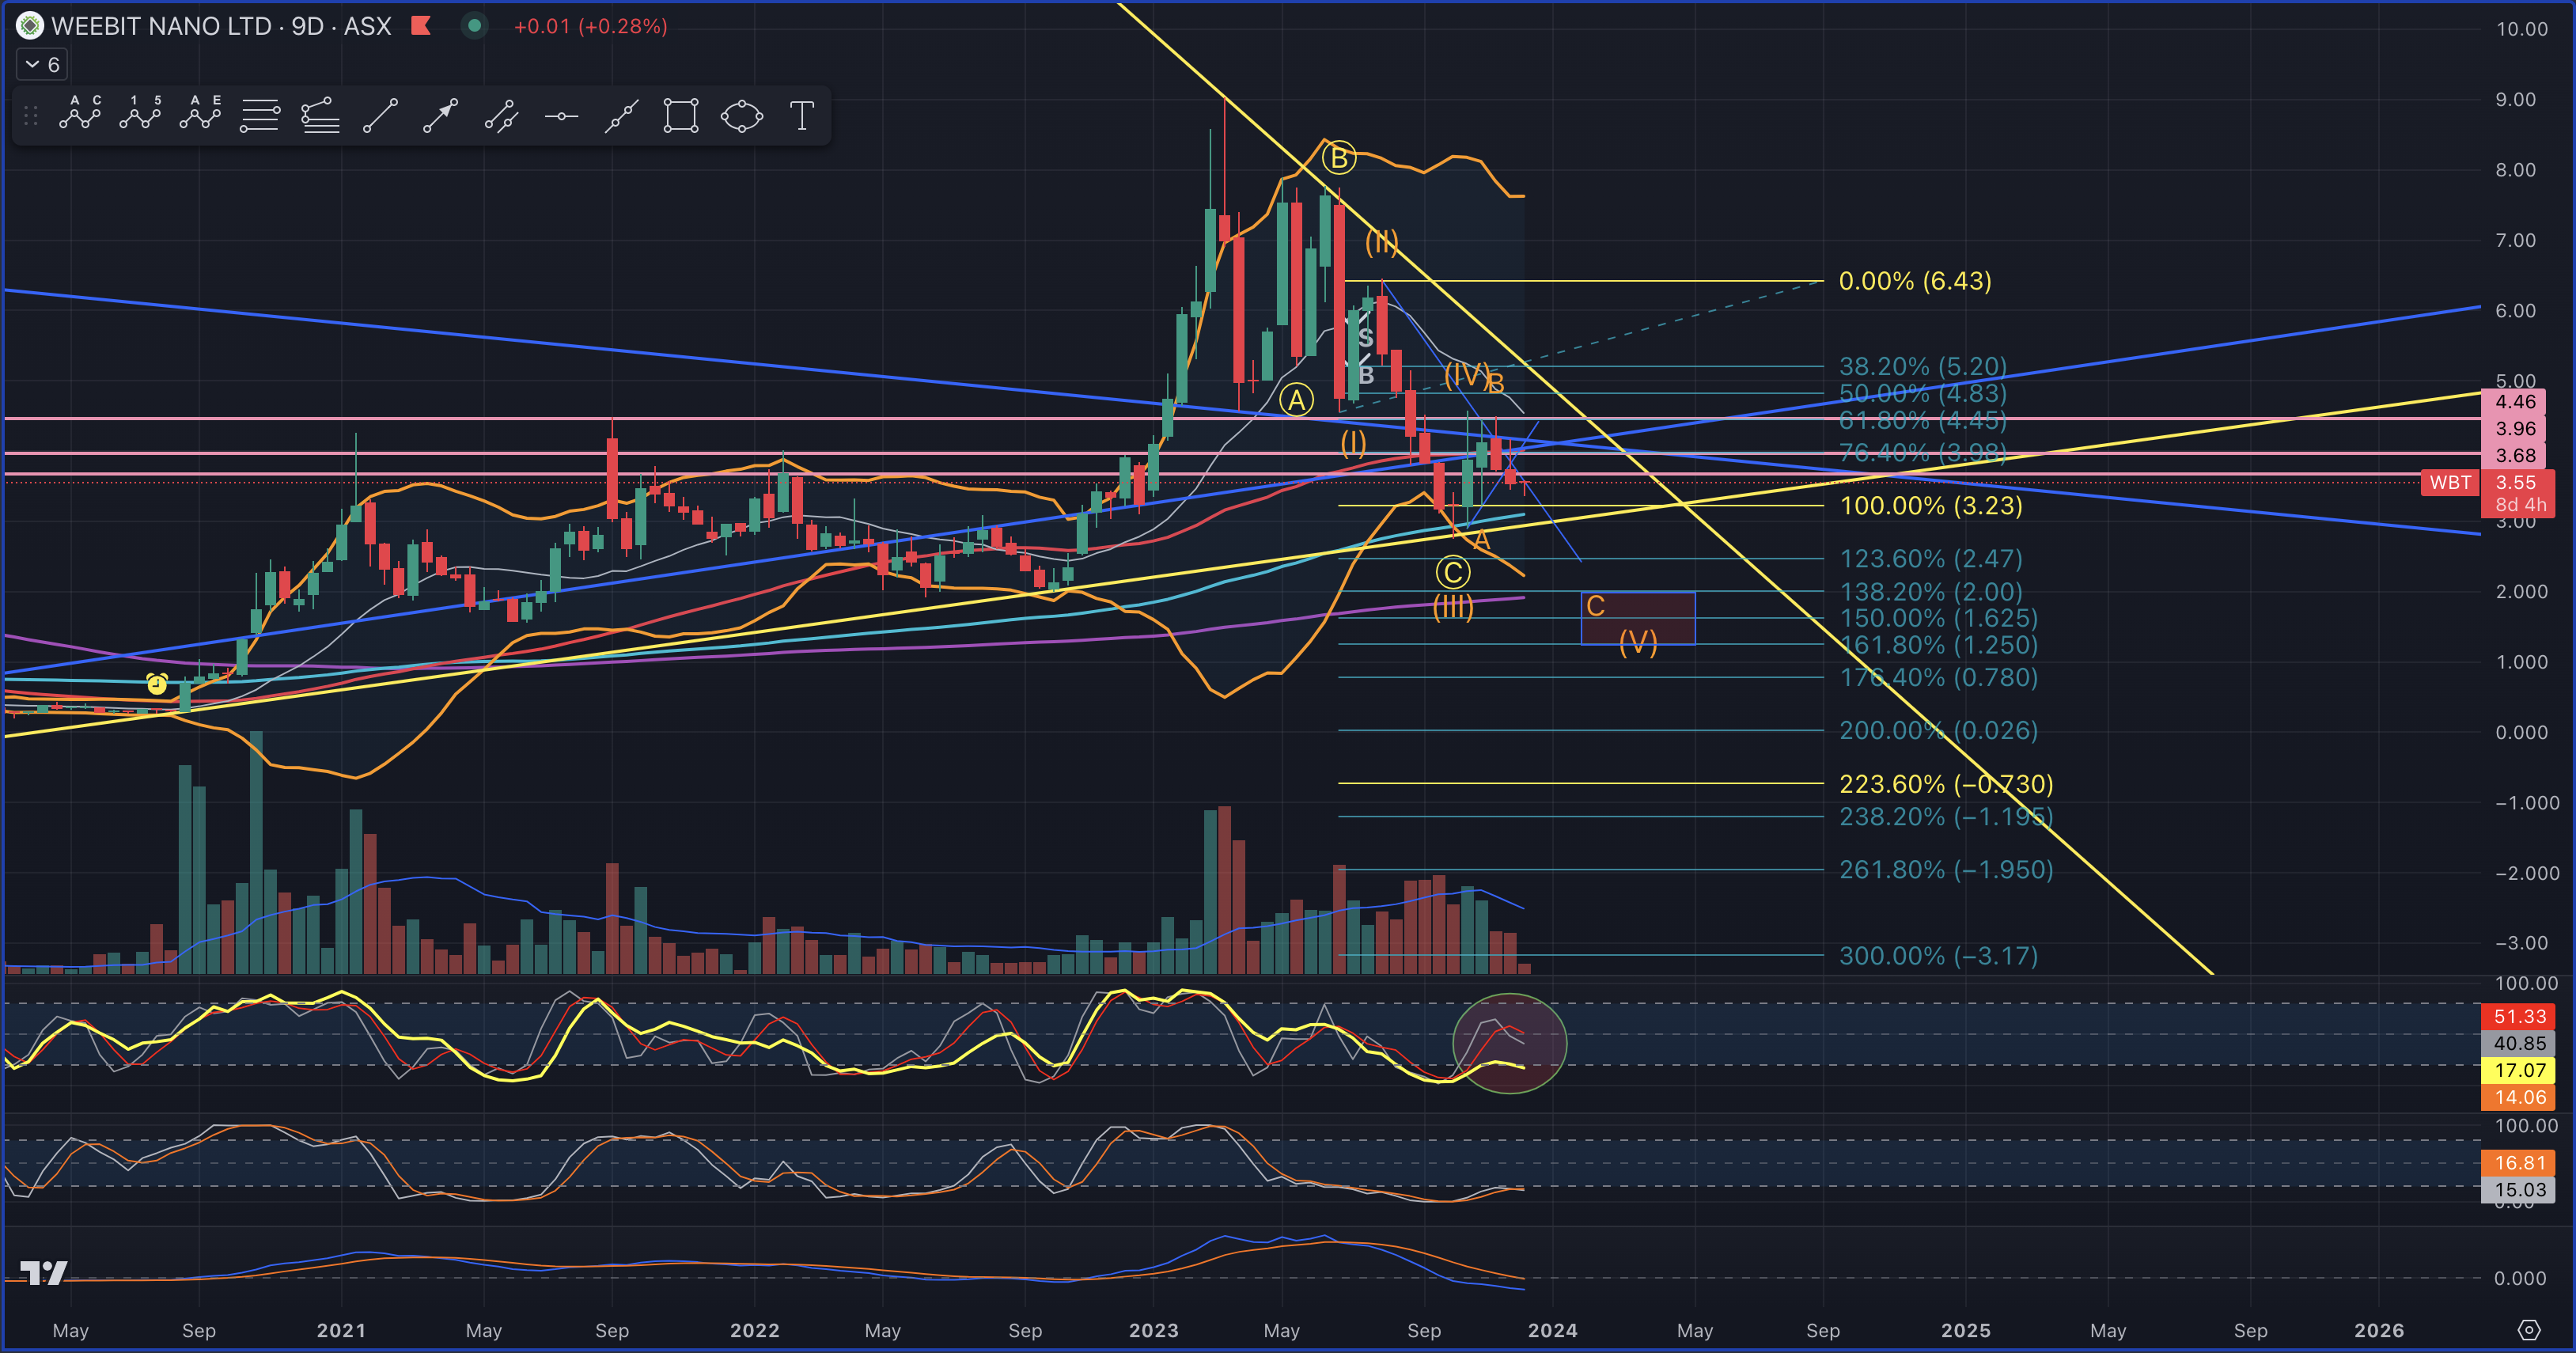
aed44815a7a99cd031aea563a7d5c832693480.png

You can see on the Stochastic Indicator, I have circled it also as it is pointing down too. I do believe the price will see the purple 200sma at a price of $2, however it may even see as low as 1.25 - 1.65.

My opinion of course is if no meaningful positive news surfaces over the next 2-3 month. You can see the same has happened for Brain Chip (BRN).

So on that note I thought it was interesting that @raymon68 mentioned JP setting up for a possible short position which would obviously align with my opinion. Could you elaborate why you thought this Raymon68 as I dont understand how you came to that opinion. Im thinking it might be because of taking a large position with Options (short) and need to put those options up to be shortable. Am I on the right track?

#Bull Case
stale
Added 3 years ago

@slymeat Interesting article, thanks Sly.

One thing that rang some alarms bells for me (and Im cretainly a novice in this space) was especially the last paragraph. I cant say I have ever seen a company refer to another companies valuation in there sector and basically say "what about me, our company should be valued the same as theres". Im not saying they are wrong or that BRN's Val is correct, no one will ever know until it plays out.

Maybe its a good thing if you hold some BRN to also hold a tad of Weebit also (may the best man win). BRN is ahead on development over WeeeeWhat with commercialisation well on its way now with licencing etc. Thats a way of for them (poss a year or 2 if and when they succeed). I know I havent read anything on the company WBT until your recent post today on them, just thought really strange for them to compare outright against a peer's val and say mine should be like there's. Its almost free publicity for BRN to anyone rerading it and proclaiming they have more traction on the market. STRANGE