Further to @raymon68 comments about possible short positions with JP morgans recent buy in, I thought I would share my techinical analysis with you all
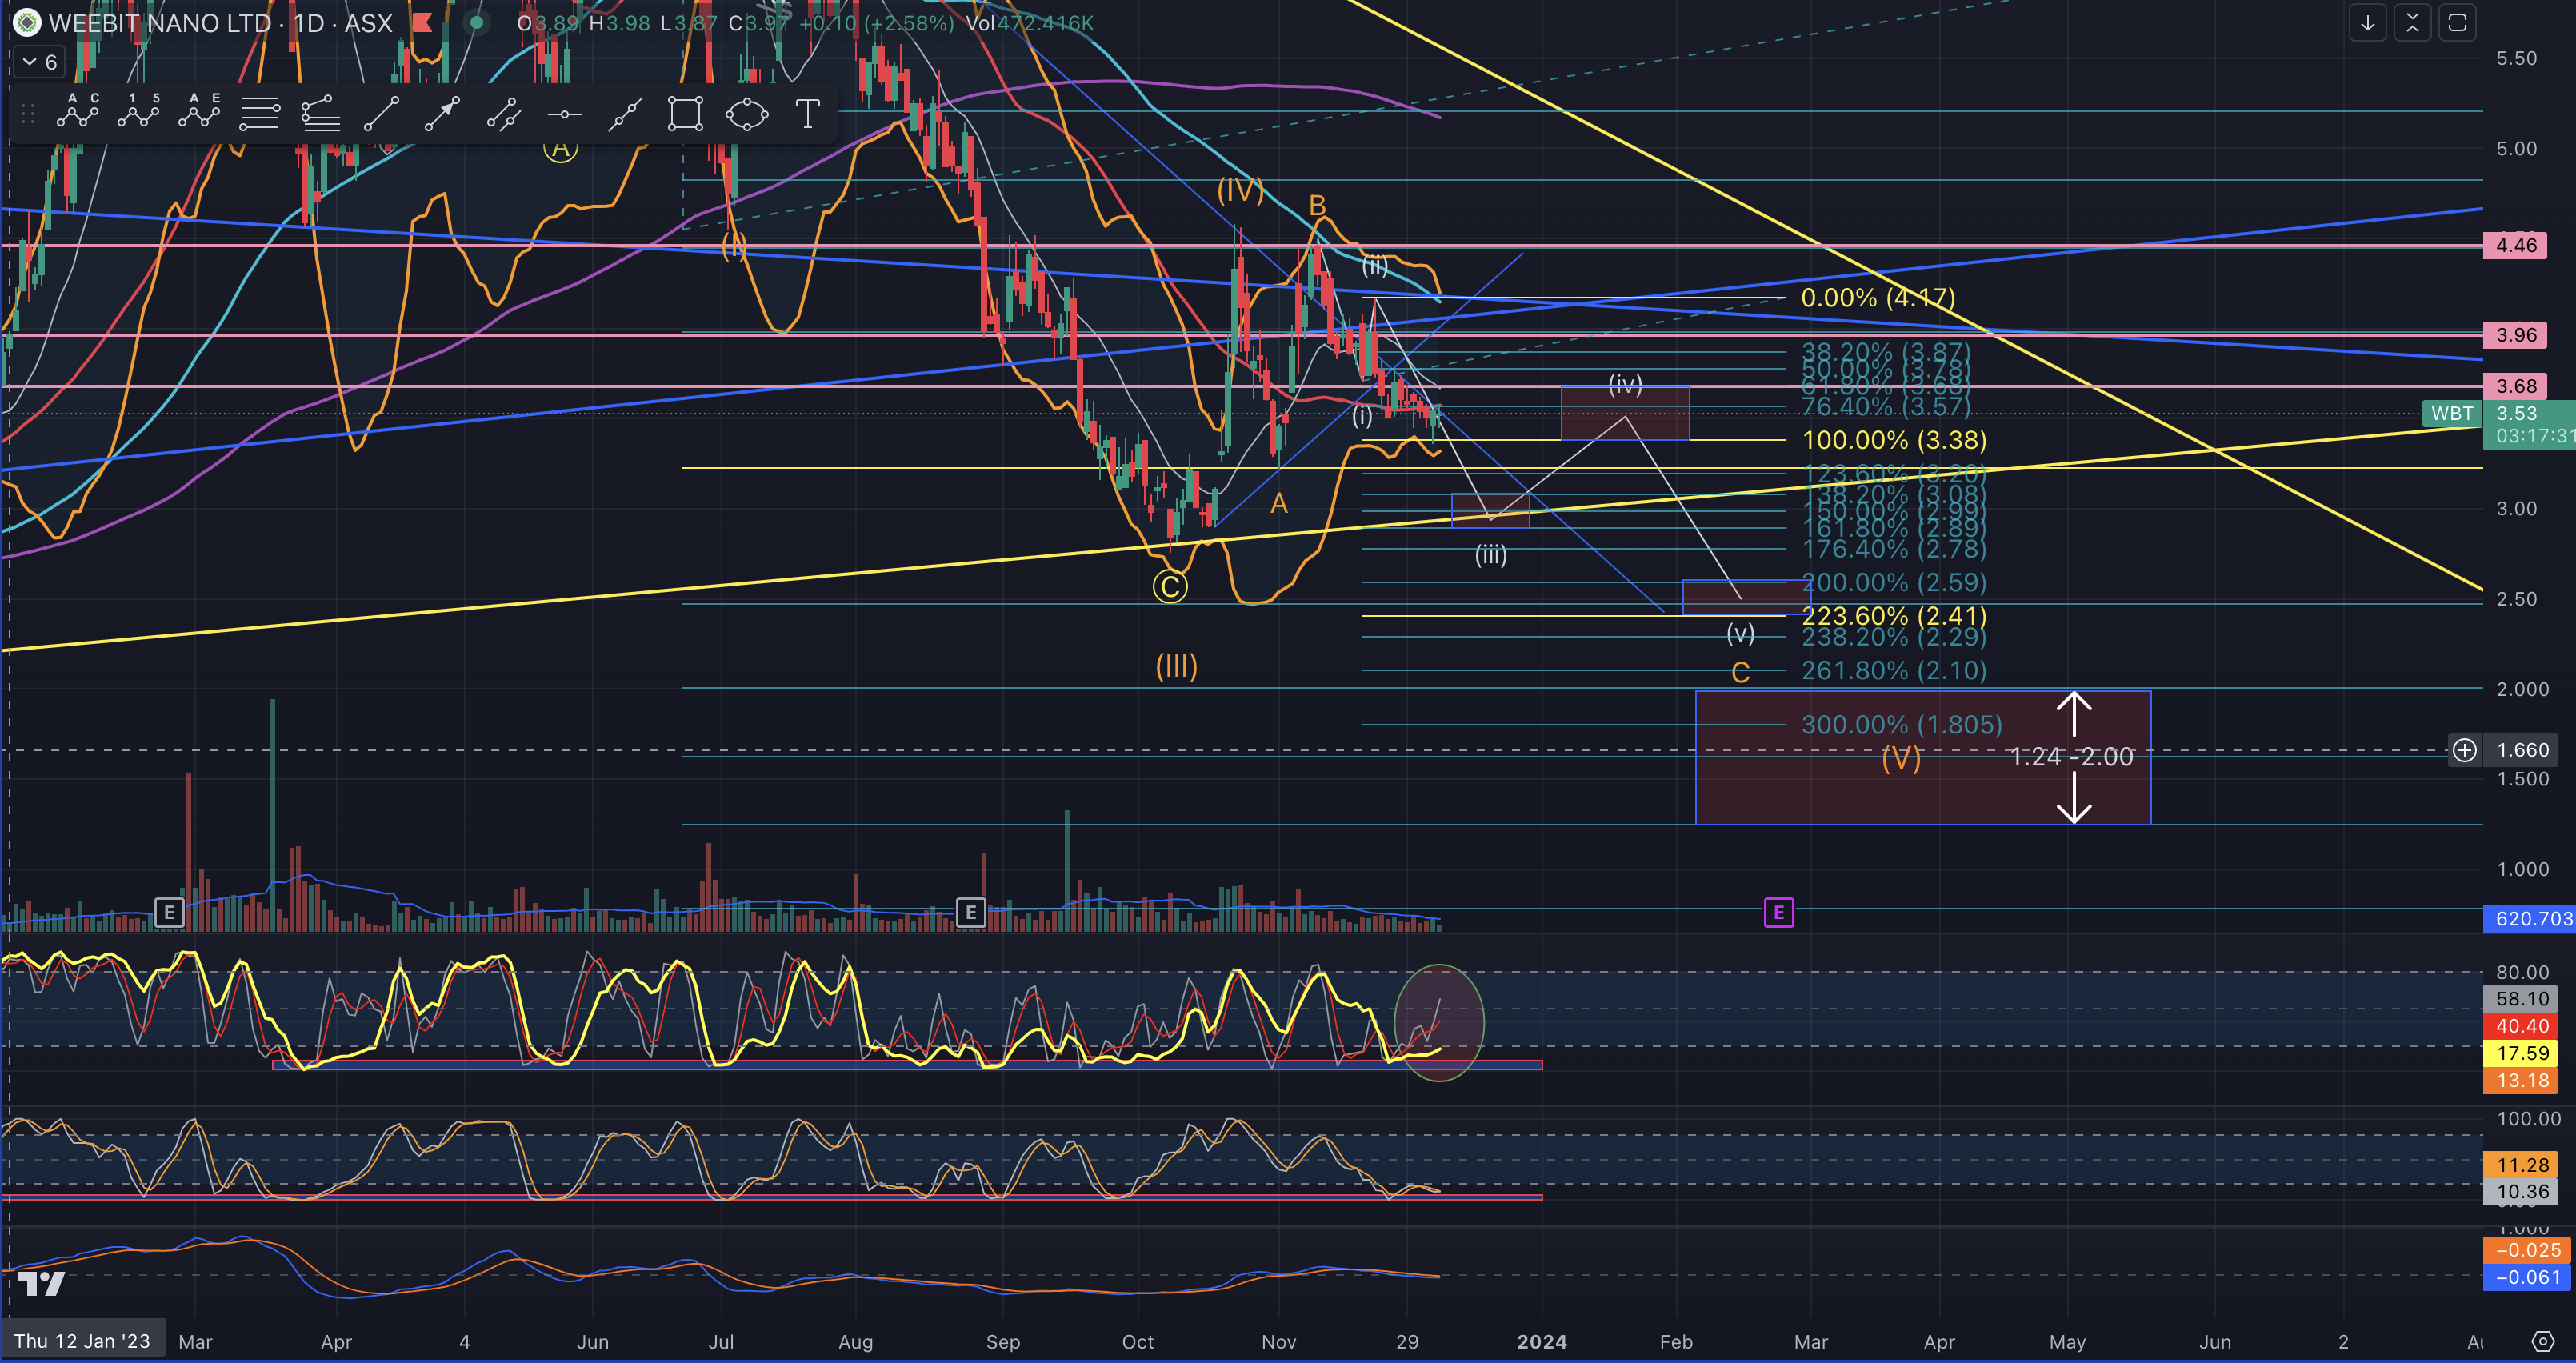
first start on the daily chart

This is the approx path (the white zigzag line down) I believe the price of WBT will take without any further substantially positive news being released over the next 2 ish months. Of coarse nothing is perfect so it may vary in time and or price points reached, however it should provide a good guide. I do a lot of chart analysis and this is based on Fibonacci levels that historically provide levels where the population and therefore automatic trading software and high frequency software looks at (obviously because software is written by humans).
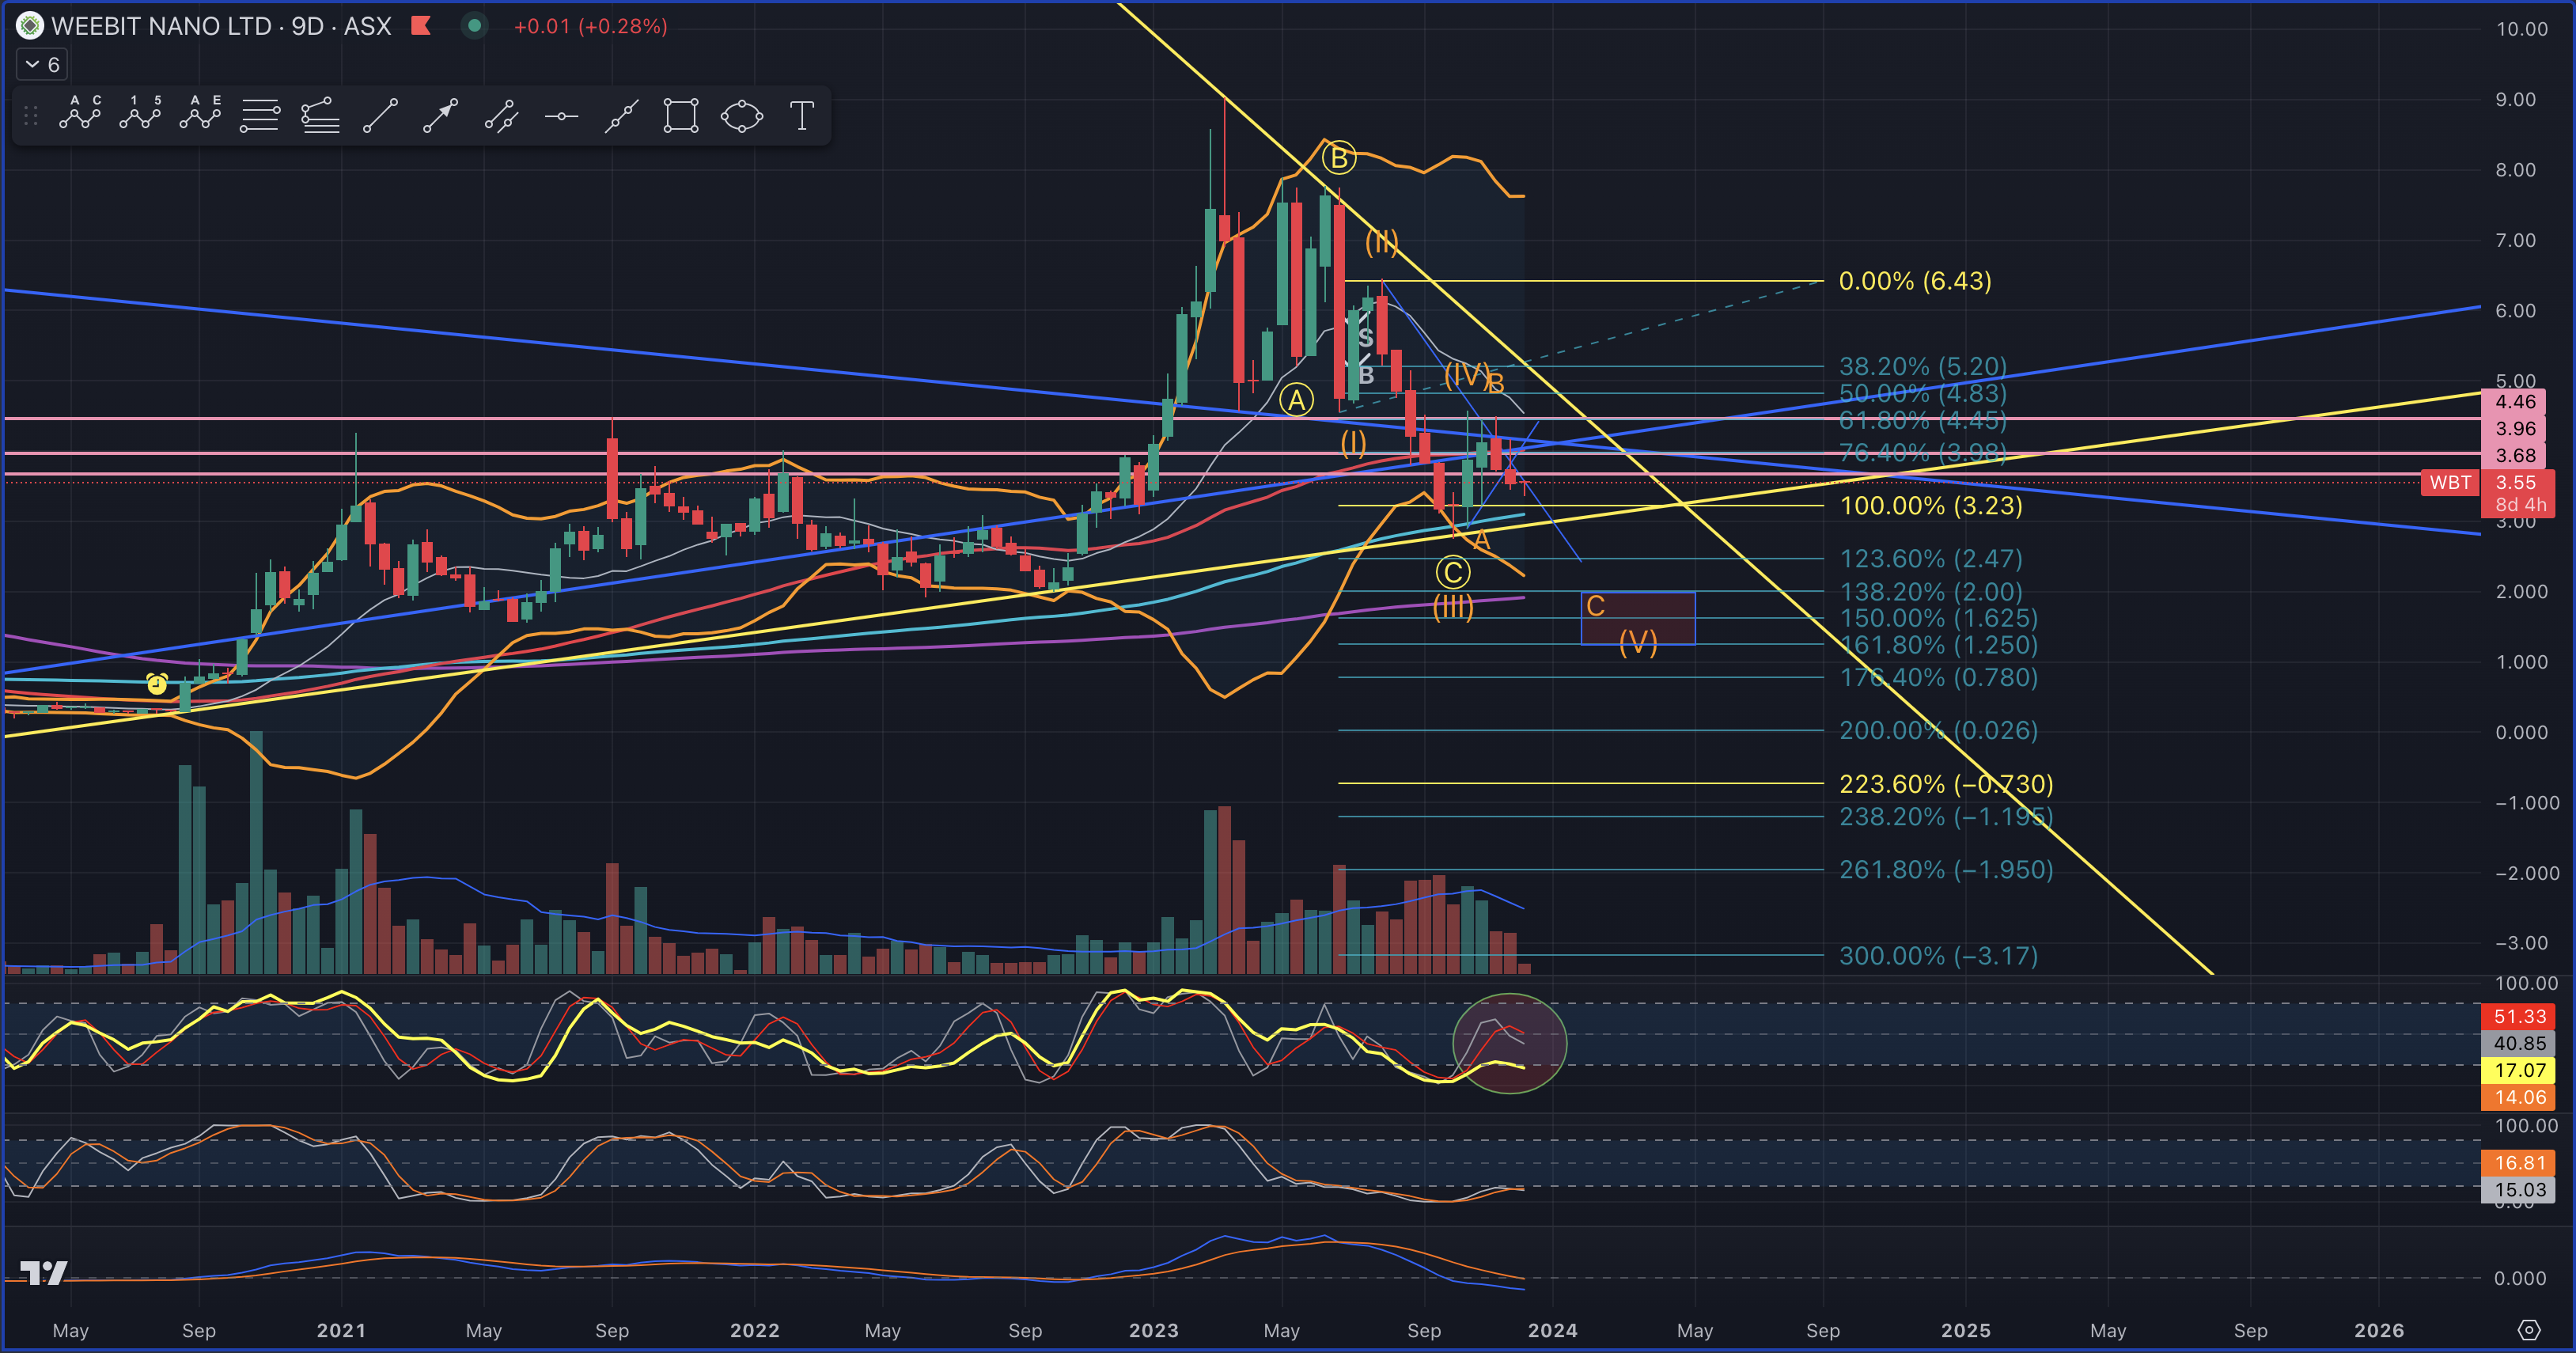
You can see WBT is stuck around the 3.58 or 50 sma at the moment although the circled Stochastic indicator below the charts is showing weakness and the RSI/Stoch indicator below that is pointing back down again. Below those 2 indicators is the momentum indicator which is just going sideways also. So im definitely seeing a drop down to the main Yellow trend line below for the (iii) wave down. You can then follow the waves (iv) & (v) in white down from there. To confirm my bearish opinion we now look at the 9day chart below

You can see on the Stochastic Indicator, I have circled it also as it is pointing down too. I do believe the price will see the purple 200sma at a price of $2, however it may even see as low as 1.25 - 1.65.
My opinion of course is if no meaningful positive news surfaces over the next 2-3 month. You can see the same has happened for Brain Chip (BRN).
So on that note I thought it was interesting that @raymon68 mentioned JP setting up for a possible short position which would obviously align with my opinion. Could you elaborate why you thought this Raymon68 as I dont understand how you came to that opinion. Im thinking it might be because of taking a large position with Options (short) and need to put those options up to be shortable. Am I on the right track?


 The last couple of days have been weak after hitting the bottom Yellow Trend line of the major consolidation triangle it has been working in. Also note the separation of the thin white line (current indicator) to the Yellow Line (long term indicator) on my Stochastic indicator. They should be following each other ish and when i see it look like it is in the green circle, then i expect the white to come back to the yellow again, therefore an drop is immanent. By how much? not sure there at the moment.


