Consensus community valuation
March 2026
$29 (Range: $21.50 - $38.00)
Note: this is the first comprehensive update to my $BRG valuation for 3 years, as prior updates were placeholders.
Method: Projection of financials to FY30, range of PEs, discounted back to end of FY26.
Assumptions: $BRG continues its global rollout, while building brand value in established markets, entrenching it position in the mid/premium segment, with ongoing strong product innovation. Economies of scale continue to be achieved through progressively expanding gross margin as well as modest operating leverage.
Revenue: 3 overall scenarios, with % revenue growth declining progressively year on year from 2026 to 2034. Scenarios defined by initial and final revenue growth rates as follows:
- Low (8% to 5.5%)
- Base (9% to 6.5%)
- High (10% to 7.5%)
Gross Margin: Increasing scale drives manufacturing and supply chain economies, %GM expands progressively across the explicit timeframe:
- Low: 36% to 38%
- Base 36% to 39%
- High 36% to 40%
Opex (ex. D&A): Annual opex growth well-controlled at 6% (Low), 6.5% (Base), 7% (High).
D&A scales 4% of Revenue p.a. to reflect ongoing investment in innovation and supply chain - no economy of scale as innovation effort will be required to maintain competitive position.
Other Assumptions:
- WACC 10%
- Net Finance Cost: 0.8% x Revenue
- Tax: 30%
- gSOI = 0.8% p.a.
P/E Ratios at Valuation Year FY30: 22 (Low), 26 (Base), 30 (High) judged based on EPS growth at FY30. Note: these are significantly lower than historical P/Es to reflect maturation of the business.
Outputs

Next Step
Update DCF to triangulate result.
Disc: Held
===================================
Feb 2025
$32.00
Placeholder update to valuation following 1H FY25 Results.
Full revaluation to come after FY in August.
===================================
May 2024 $26.00
Quick update to valuation
Current SP is a little below the long term average P/E, and bang on the mid-point of my current valuation of $26.00, representing fair value.
SP of $25.96 compares with analyst TP consensus $25.45 (range $20 - $31.30, n=15), which is about 12 months into an upgrade cycle from a low point TP of $22.
===================================
March 2023 $23.70
First attempt at a valuation of $BRG
Revenue
- Consumer slowdown sees slow growth in 2023 (3.3%) and 2024 (5%), staying in positive territory due to restocking in Europe and continued penetration in new territories
- Thereafter a return to 16% annual revenue growth - the pre-covid average, driven by market share gain, minor bolt-on acquisitions and continued new territory entries
Gross Margin
- Maintained at 35%
Expenses
- Constant at 21% of revenue
- Economies of scale offset by need to continue to invest in innovation and sales and marketing to maintain top line growth and brank premium
Capex: maintained at 4.50% of revenue
Working Capital
- Currently carrying $213m excess inventory
- Assume this is unwound over the balance of FY23 and FY24, turbocharging short term operating cashflow
Model Outputs
- EBIT margin stable between 11.5% and 12% over 2023-25, then progressively improves to 14% by 2032.
- Note that this is very high in the peer group, and it only possible due to the capital light operating model
- Net Margin below 8% 2023-25, then slowly builds back to 9.8% by 2032. Again - ambitious but has been achieved in 2013-14
- Assumption is by the end of the explicit period, there are few/no new market entries, and margin expansion is achieved through scale benefits within existing markets
Assumptions
- WACC 11.0%
- CV FCF growth of 7% p.a.
Sensitivities
- $21.94/share (WACC 10%, CV FCF growth of 5%)
- $20.72/share (WACC 11%, CV FCF growth of 7%, Rev. growth 12%)
Key focus for next report
- How is cash being freed up from the business?
- How slow is revenue growth? (Does Europe restock as predicted)
- How are margins tracking?
Nice:
Double-digit growth across all Theatres, led by strong performance in Coffee
• Gross Margin % held broadly steady
• EBIT growth of 10.2% at the top end of February guidance, with operating expenses aligned to 11.4% Gross Profit growth
• NPAT growth of 14.6% driven by reduced average borrowing across the year


Wealth Creator
5 year chart
Return (inc div) 1yr: 25.02% 3yr: 19.33% pa 5yr: 7.06% pa

Kitchen appliance maker announced their 1H25 results today.
The Summary and Their Highlights

- Solid revenue growth of 10.1% against a backdrop of resilient consumer demand
- 13.0% Global Product segment revenue growth (constant currency)
- Double-digit revenue growth in all three Theatres (Global Product segment constant currency) led by strong Coffee category growth
- Group Gross Margin held steady at 36.7% of revenue with 10.3% Gross Profit growth
- EBIT growth of 10.5% with 1H25 operating expense growth aligned to Gross Profit growth
- NPAT growth of 16.1% with lower interest costs arising from strong FY24 cashflow generation
- Net Debt of $55.1m, an improvement on pcp balance of $97.5m
- Strong underlying cash generation partially offset by tactical pull forward of 2H25 US inventory as a hedge against potential tariffs
- Interim Dividend of 18.0 cents per share (100% franked)
My Notes from the Investor Call
This was another very solid performance from $BRG with a clear and almost monotonously solid double act from CFO Martin Nicholas and CEO Jim Clayton.
In constant currency, all theatres performed well in the major Global Product segment, pleasing to see AMEA and APAC posting strong cc revenues growths, with the sluggish consumer demand in established markets being offset by the new markets.
US sales were strong, allowing Americas to post double-digit growth, even given the failure of a retail partner in Canada which was a tailwind in that market.
$BRG has sought to anticipate China tariffs by pre-loading 2025 inventory into the US. (Easy to do, as they can just keep their manufacturers running at the pre-Xmas build up levels for a few extra weeks.) This large inventory has hit free-cashflow, but makes perfect sense as it protects the FY25 result from any tariff impact, unless sales outperform and additional replenishment is required.
On supply chain, about 40% of revenue is exposed to the China-US “pair”, but Jim sees this exposure falling to 10% by 1 Jan 2026. He emphasises that their preparations here have been three years in the making, following their decision post-pandemic to diversify their supply chain. It was not an anticipation of Trump, but it highlights the importance of setting up resilient supply chains for all unknown unknowns!
Gross Margin was bang on PCP at 36.7%, and expense growth matched revenue growth leading to EBIT growth of 10.5%.
The relatively strong NPAT growth of 16.1% was enabled by reduced interest charges on lower debt, as $BRG heads to a conservative balance sheet with Net Debt at 0.2 x EBITDA and a net cash position. There is now ample balance sheet capacity for further expansion (organic and inorganic) as well as capital management.
There was some significant Q&A discussion on the apparently very soft and comparatively wide FY25 EBIT guidance range of 5-10% growth. Jim explained that this locks in the impact of the 10% Trump China Tariffs, and provides some capacity for “knowns unknowns”. He wouldn’t be drawn to discuss what he thinks will happen, preferring to answer with “imagine I was in the steel industry” and explaining how in one week any assumptions in that industry have been torn up.
Jim and Martin both explained all the levers they have to manage the impact of tariffs, with Jim saying that it is important for him to take the right tactical decisions that will impact company performance over two years, without impacting the strategic direction of the firm that plays out over 15 years.
As always, Jim picks several strategic topics to focus his presentation on. This time there were three:
· Beanz Service Update
· Geographic Expansion
· New Products
Beanz is a global coffee as a service model, now active in 4 countries. Its basically a platform enabled via machine sales, where $BRG allows customers to purchase beans direct from leading roasters. The technology platform is global, and can be turned on in each market when the partnership ecosystem is in place. Jim discouraged the analysts from building it into their models, but did indicate that over time, he believes it can become material. (Maybe I’ll try it out as it operates in Australia.
Geographic expansion is focused on Arabian markets and moving to a direct model in China, which will be predominantly online, as this is how most sales in that market currently occur. Jim explained that the geographic expansion has increase $BRG’s addressable market by 35% over that presented at the Macquarie Conference last year. “Many years of work to do!”
New products are focussing heavily on coffee, which remains the leading category, including fully automated machines, and accessories which can be used with all machines.
My Key Takeaways and Valuation
While a good result, $BRG is very fully valued (as are may high quality businesses at the moment.)
Thus today's SP response, -2% at time of writing is not a surprise.
I still have a small RL holding, having sold most of position 6 months ago around $34-35. I need to update my SM valuation which is currently out of date at $26. While I won't do a full valuation update until after the FY result (too many more pressing priorities), a midpoint of around $32 is probably closer to the mark.
I - as well as most analysts - are less bullish than the market (see below), so I need to take some time and better understand why.
Any future wobbles on tariffs might hit $BRG SP, which is partly off its recent highs as a result, and I will be patient and poised to move back in to this core holding, should the opportunity arise.
Disc: Held in RL only

I thought Breville might be a good one to consider to take advantage of the US dollar appreciation as a result of Trump victory in addition to the usual suspects James Hardie, ASX listed biotechs (you know who) with US operations and Computershare
Alas it was not to be

PWH moment for BRG?
Need to strike Breville off my list at least in the short term for now till we see how this "transition project" progresses.
I'm still looking at a couple of small caps including a NZ listed biotech that is forecasting 200m USD but has had a history of disappointment (which I hold)
Kitchen appliance manufacturer $BRG released their FY24 results today. (Investor call at 9am)
Their Highlights

- Record sales year with revenue of over $1.5bn, more than doubling over the last 5 years
- Full year revenue growth of 3.5% with a marked strengthening in 2H24 led by double-digit revenue growth in the Americas, EMEA and the Coffee category in the Global Product segment
- Gross Profit grew by 7.7% with Gross Margin improving 140bps
- EBIT growth of 8.0% to $185.7m, above top end of guidance given in February 2024
- NPAT growth of 7.5%, after reversion of effective tax rate to 28.5% (pcp 27.0%)
- Net cash position achieved with strong cash inflow of $174.9m substantially driven by inventory levels returning to equilibrium, whilst Gross Margin increased
- Dividend of 33.0c cents per share (100% franked)
- Revenue, Gross Profit and EBIT have all increased every year since FY15
My Analysis
Another steady performance from this, one of my longer-held ASX positions.
Top line growth is muted by historical standard at +3.5%, however, all key markets have high interest rates and a subdues consumer environment. The 3.5% growth likely combines volume declines in major established markets, offset by pricing increases and growth in recently entered markets, as the global rollout continues.
%GM expanded from 35.0% to 36.4% actually surpassing the pre-pandemic high-water mark of 35,6% in 2018. This demonstrates that $BRG is managing its input costs and supply chain and able to pass on increased costs through pricing - leveraging its growing brand value.
Cost discipline was exemplary, with operating expenses only expanding by 4%.
EBIT came in at the top end of the range, and at $185.7m is a slight beat to consensus of $183.6m.
A highlight is the strong operating cash flow of $303m and FCF of $220m. The biggest driver of this was the return to normal inventory levels, The FCF was almost 3x the previous record in 2020.
My Key Takeaways
Overall, from this quick scan, I consider this yet another very good result in a challenging global retail environment, demonstrating that Jim and his team continue to manage this global business extremely well.
I'm not expecting much on the market front. There might even be a sell off, as the SP has run up hard into the result, with yesterday closing SP around 12% above the consensus TP. But I could care less. This is a quality company and one of the long term compounders in my RL portfolio.
I'll sign off here to join the call.
$BRG are presenting at Macquarie Conference today.
The presentation takes a step back and considers the progress of the business over the last 7 years in Jim Clayton's characteristically thoughtful way. Given everything that has happened over recent years, the steady progress has been remarkable.
And even though FY24 EBIT growth guidance is underwhelming at 5% to 7.5%, this has to be considered in the context of the current global headwinds to discretionary spend. Good news is that FY guidance is held to.
In the presentation Jim quotes the late, great Ayrton Senna:
"You cannot overtake 15 cars in sunny weather ... but you can when its raining."
I've also added 2 further slides.
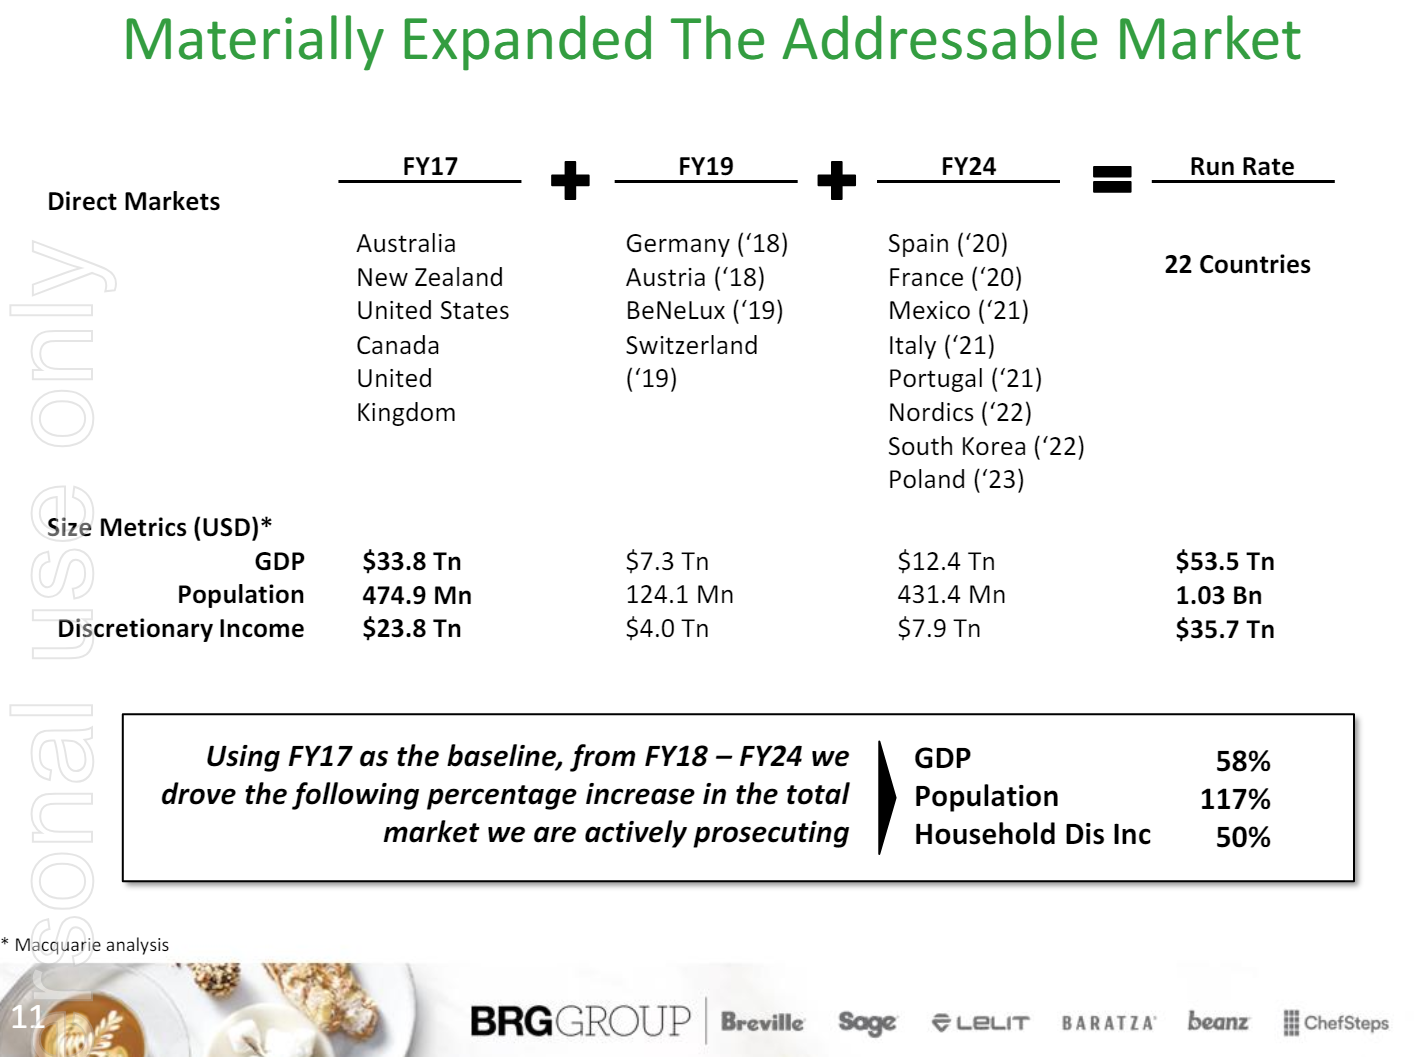
First, that shows the global geographical expansion over recent years, which indicates that $BRG is positioned to growth strongly once the macro-economic cycle turns.
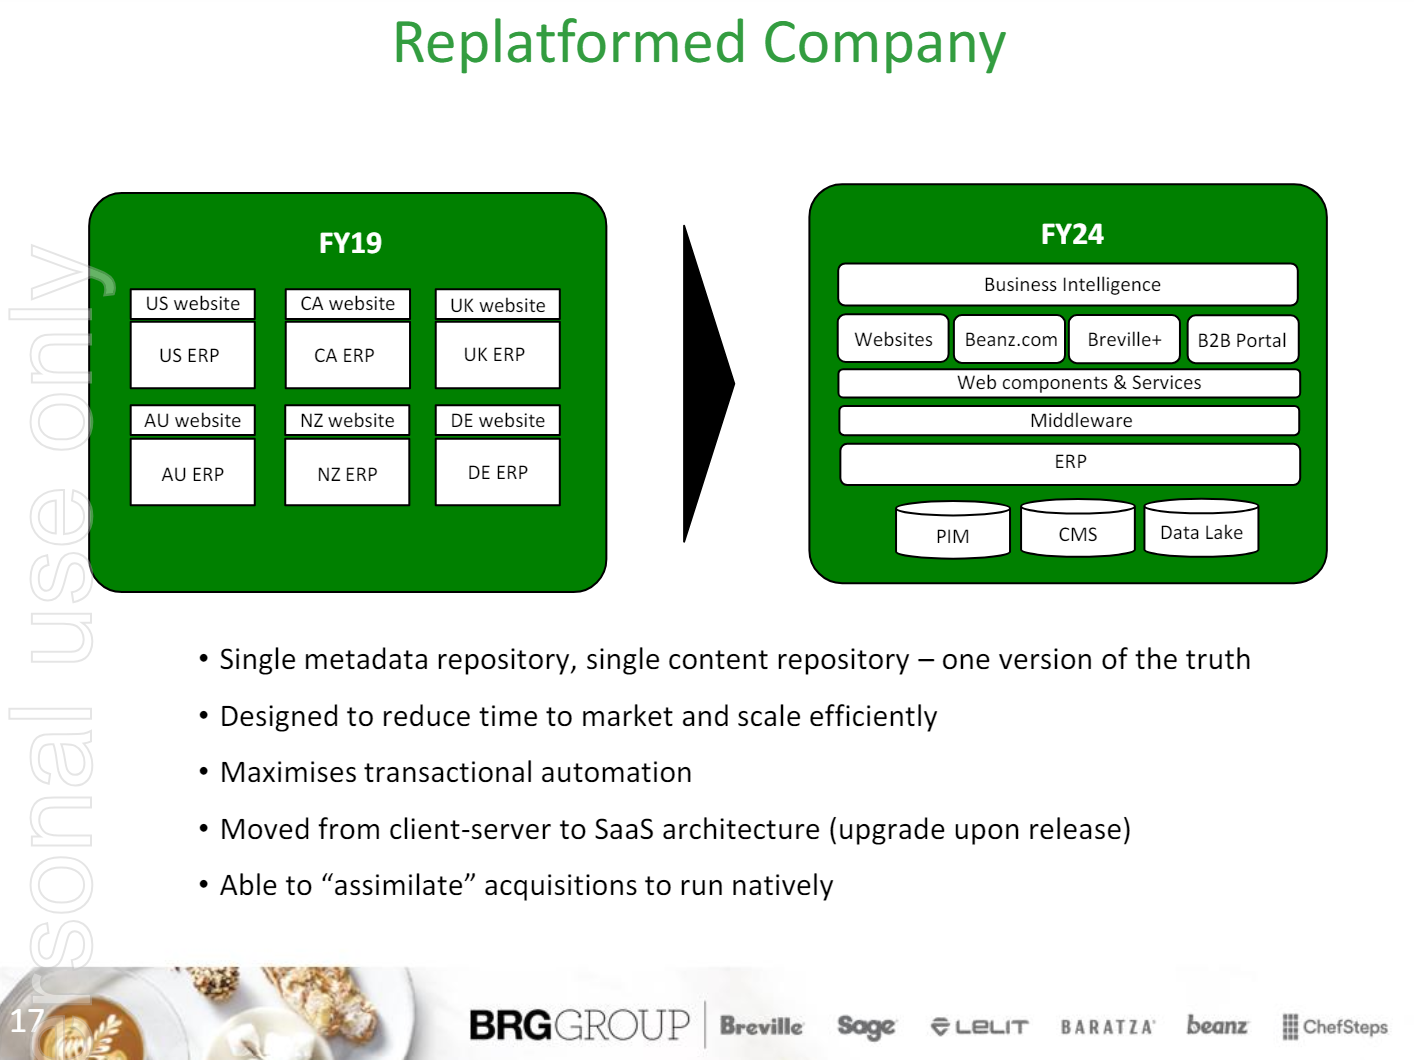
The second, gives a flavour of the recent investments made in re-platforming the business, which has developed a strong direct to customer channel, alongside its retail channel. (I purchased my last Breville product this way.)
This is a long-term hold in my RL portfolio. Never exciting, but over the years you notice!
Anyway, I thought I'd post as the presentation gives a great overview of the business at a more strategic level than the periodic results reports.
Value
Current SP is a little below the long term average P/E, and bang on the mid-point of my current valuation of $26.00, representing fair value.
SP of $25.96 compares with analyst TP consensus $25.45 (range $20 - $31.30, n=15), which is about 12 months into an upgrade cycle from a low point TP of $22.
Disc: Held in RL
Kitchen Appliance maker $BRG announced their 1H FY24 results this morning.
SP reacted negatively down in the range -8% to -12% so far this morning, due to a 5% revenue miss vs. consensus, and with FY EBIT guided at +5.0-7.5%, that a range of $181m-185m, which is slightly softer than the consensus this morning of $187.5m (n=13). More on all that below.
Their Summary
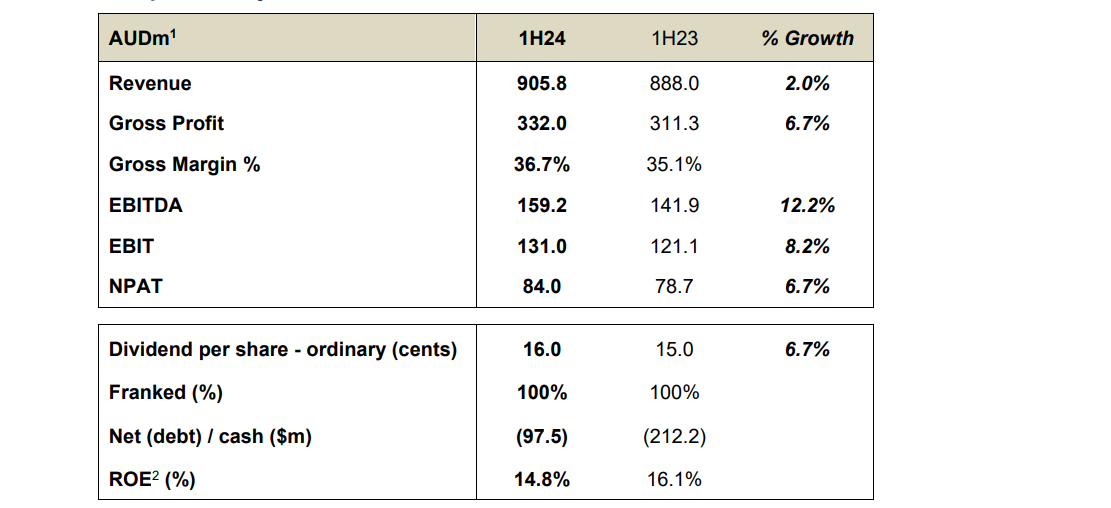
- 2.0% revenue growth against a challenging consumer backdrop
- 5-year Global Segment CAGRs (compound annual growth rate) still strong at 15.5% in constant currency terms
- Gross Profit grew by 6.7% with gross margins strengthening as input costs abated and investment into promotion was well controlled
- Operating costs contained to 5.7% growth
- Forecasted increases in D&A (depreciation and amortisation) occurred following acceleration in new product launches. Other operating costs held broadly flat
- EBIT growth of 8.2%, ahead of sales, and in line with plan
- NPAT growth of 6.7%, after absorbing higher interest costs
- Forecasted inventory and net debt reductions were both delivered. Further inventory reduction and cash inflow is forecast in 2H24
- Interim dividend of 16.0c cents per share (100% franked)
My Analysis
I feared running into today's result that the market had gotten ahead of itself. In fact the SP has had a strong run with yesterday's close up 45% from the retail-funk trough of March-23. (However, I didn't have the conviction to trade it!)
Overall, consensus aside, it was a pretty decent result, and I always enjoy listening to CEO Jim Clayton explain how they manage the business.
Revenue
Their key Global Product segment grew evenue at only 1.6%, which was actually a decline of (1.3%) in CC. Of course this is masked by the strong growth in new markets of 73%, albeit off a small base (Mexico, Portugal, Spain, France, Italy, Poland and South Korea)
The Distributon Segement grew more strongly at +4.6%, driven by a recovery of Nespressor sales in the Americas.
Looking on a cc basis, Americas was weak at (2.2%) as was APAC (5.7%) while EMEA recovered to grow at 5.5%. The weak Americas and APAC numbers have triggered the surprise, as these were not expected based on the results of competitors or ther overall market segements.
Gross Margin
However, Gross Margin was strong with %GM expanding by 160bps from 35.1% to 36.7% due to better inputs costs and well-controlled promotional spend.
Operating Profit
EBITDA was up 12.2% and EBIT up 8.2% well ahead of sales. CODB has been well-managed only up 2%, with EBIT lower due to increased D&A as a result of higher investments in production innovation and new SKUs. The new product line positions the business strongly for FY25.
NPAT
Interest was up 28% driven by rates, albeit debit is modest at 0.4xEBITDA.
Cash Flows & Balance Sheet
Inventories have continued to be managed back towards more normal ratios.
Net debt has been reduced significantly, which will reduce finance costs in H2.
Cash and equivalents stood at $146m up from $115m, with dividend increased by 6.7%.
My Key Takeaways
Revenues were indeed softer than expected, however, management consciously decided to push more for gross margin and operating profit. CODB has been very well controlled, well below inflation!
This is a business that has been well-managed through COVID, the following supply chain challenges and a softer global environment for discretionary retail. By investing heavily through that period in new products and new country entries, as well as its online platform, $BRG is well-positioned for the future.
FY EBIT guidance is slightly under the FY consensus, but at 5%-7.5% for - what could be the bottom of the discretionary cycle - I'll take that any day!
The market response is not surprising, as it brings the SP closer back towards consensus.
$BRG is part of my 9% RL exposure to discretionary retail (along with $LOV and $NCK). I'm looking at the market response and thinking this could be an opportunity to increase my position slightly. However, I'll wait a day or two in case any broker downgrades lead to any further selling.
In my view - a solid result, by a well-managed, global business serving the retail market.
Disc: Held in RL, not on SM
Earlier today @raymon68 posted a summary of the $BRG results, which were well-received by the market. The market reaction is even more remarkable given that the SP had rallied up about 20% in the 6 weeks leading up to the results.
We are certainly seeing a bifurcated market response to retailers. Those performing well (e.g., $NCK), are getting a strong positive reaction, given that overall sector multiples are below their through cycle average. Those underperforming (e.g., $ADH) are getting hammered.
$BRG's result was a very slight positive surprise at both the preferred EBIT metric and at NPAT. But on the face of it, hard to explain such a positive market response. Hpwever, as @thunderhead points out, for the last year $BRG has carried quite a high short position, ranging from 7% to 9%, so a positive result gets amplified in these cases as some shorts attempt to cover their positions.
While retail mutiples are generally depressed, this can’t be said for $BRG. Heading into today’s result, it was on a forward p/e of 30. With today’s result the p/e has popped up to 35, at time of writing. If we discount the pandemic-hit period of mid-2020 to early-2022, $BRG tends to trade on an average trailing p/e typically in the range 25 – 35. So it is rather odd that it should be riding so high, given the uncertain out look for retail spending globally.
In my portfolio, I consider $BRG as part of my retail exposure. It is in fact my largest single “retail” holding at 3.3% of my RL portfolio. However, while it clearly is exposed to the global retail trade, its business model has some unique differences to the general retail sector of "shopkeepers". Retailers are, of course, the lion's share of $BRG's customers. So what's different about its business model?
- It is a strong and growing retail product brand which is being deployed globally. While offering several price points, much of its range is targeting the premium end of the market.
- It designs its own appliance range, but (except for the FY22 Lelit coffee acquisition) it outsources all manufacturing, so the business is capital-light. Basically, it manages the supply chain, but doesn't own supply chain infrastructure.
- Its cost structure lacks the high fixed costs of retailers. So even though its % net margin is typically only 7-8% - much lower than the best retailers - much of its cost structure is variable or semi-fixed, given its capital-light business model.
- It invests heavily in innovation by 1) following customer trends (e.g., home barrista, air-fryer revolution, home “Master Chefs” - the introduction of Turbo Sous Vide), and 2) integrating technology into appliances (phone aps with celebrity recipes that control the high tech airfyers)
- It is now launching services around the products, launched recently in the USA. (Nice idea, let’s see how that goes.)
- It has a management team that is relentlessly focused on innovating to create scalability including: i) an improved new product launch template, ii) an enterprise platform that increasingly automates how it deals with its customers to drive scalability, iii) a fast-growing online direct-to-customer platform, and iv) a modular standard web platform that can be tailored and configured easily to each specific market without out the need to create individual country websites.
CEO Jim Clayton takes some time each investor presentation to describe that latest innovations, leaving the reporting of results pretty much entirely up to his CFO. He is a CEO very focused on innovation to drive both customer value and operational efficiency.
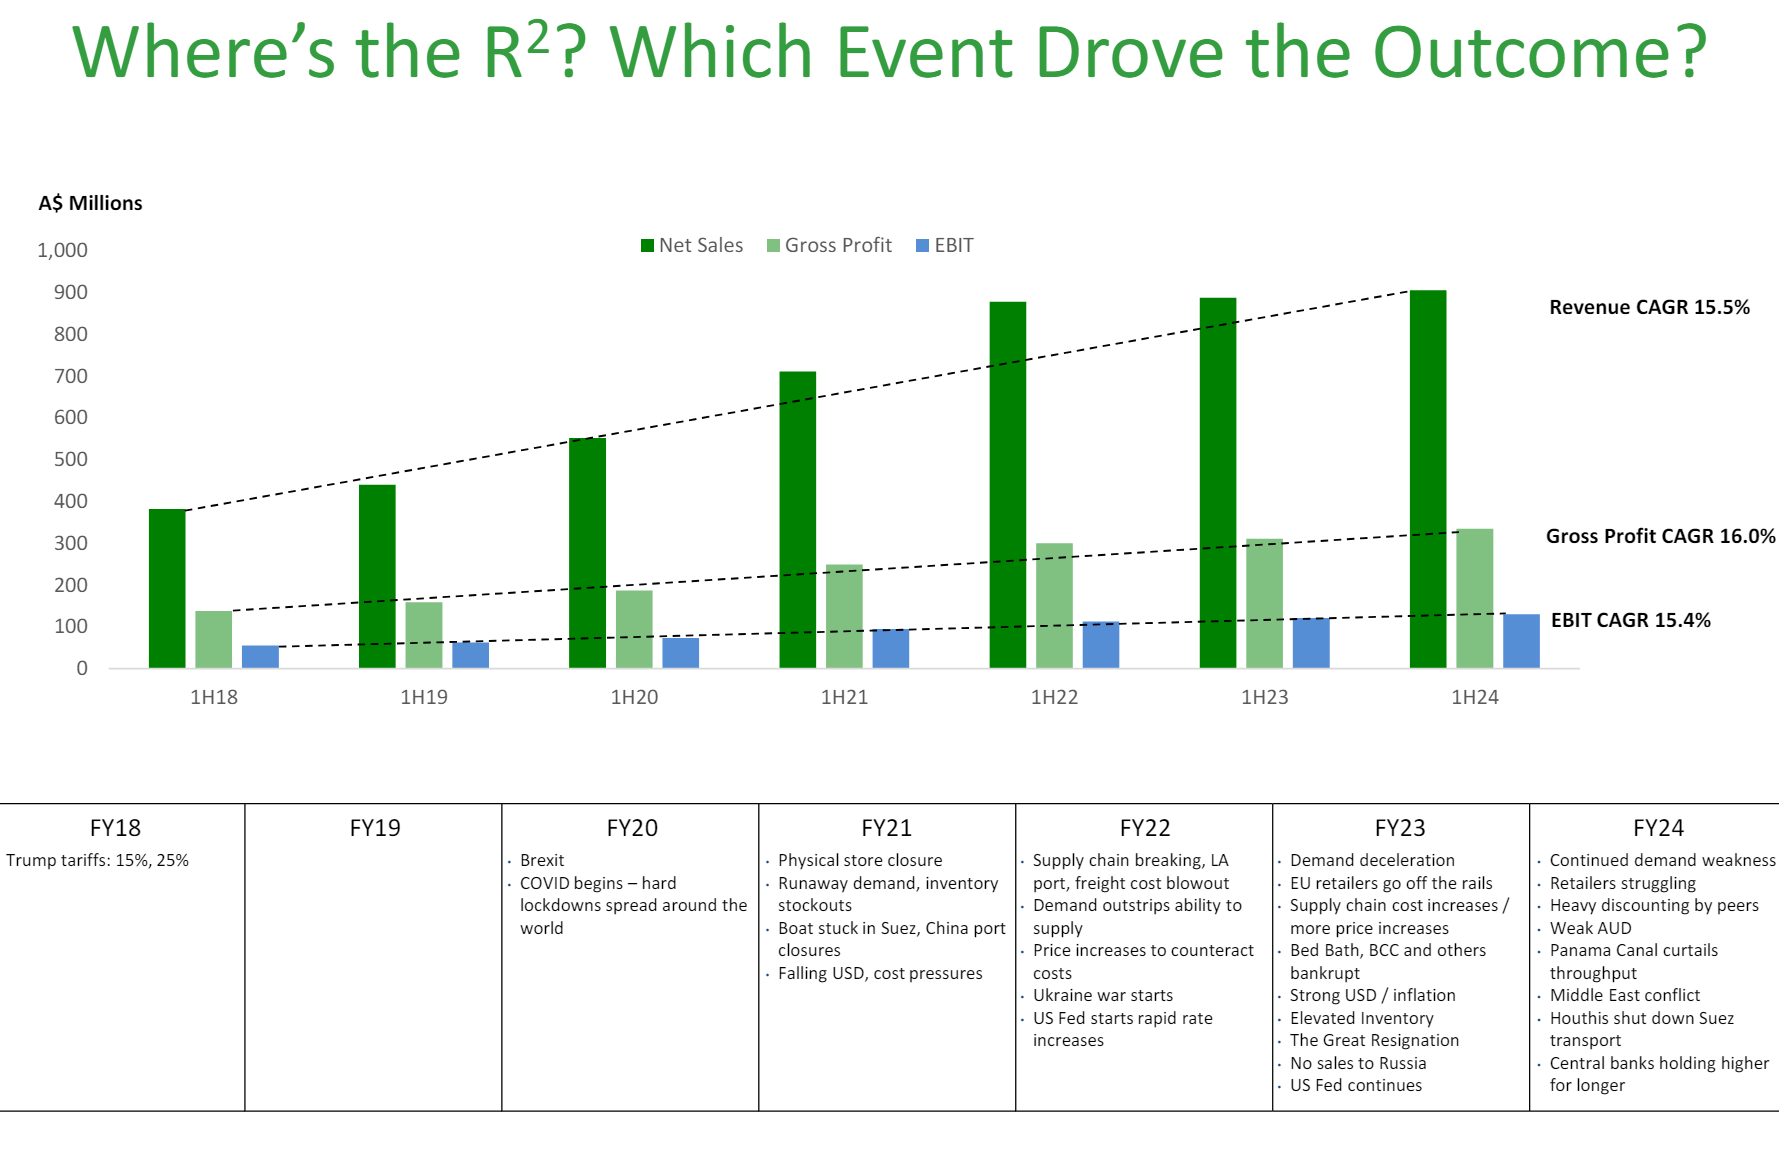
For me, the one slide that best sums up how $BRG has fared over the last year is shown below.

Innovation and new market tailwinds overcame the headwinds of the global downturn and the impact of the bankruptcy of Bed Bath and Beyond – a major customer in the US. Note the new countries showing +96% revenue growth from a very small base, but these now roll forward into FY24 and are decent-sized markets.
The %GP line shows how the headwinds were offset by the ability to pass costs on particularly at the premium end of the range, as well as their ability to control costs by reducing promotional spend to increase operating margin. Innovation in the business platform and controllable costs meant that in a weaker year of underlying growth, $BRG managed to maintain double-digit EBIT growth (just!).
My Key Takeaways
I’m holding a valuation of around $22/share for $BRG. So, at today’s fly-up of to over $26.00, I certainly am not buying at these prices.
Not all markets are seeing discretionary spending hit as hard as Australia, because of the near unique nature of our housing market. And $BRG’s product range is pitched at a market segment that may prove to be less price sensitive in an environment of general inflation. So, I think the SP reaction today perhaps reflects the market’s immediate response to the results as a sign that $BRG’s global growth strategy – both taking share in existing markets through product innovation and brand strength while progressively adding new markets – will drive on through the current downturn. Certainly, CEO Jim was very confident in his presentation today, albeit recognising that FY24 will be a tough year.
I believe $BRG is a well-managed company. It has proven so during the pandemic when it ramped up inventory to maintain the ability to keep customers supplied, and has proven that it can slowly return inventory to normal levels while trending %GM back towards historical levels. It retains multiple levers for growth and margin expansion that can help it continue to progress against the macro-headwinds, provided its key markets can avoid a deep and prolonged downturn. Its innovation engine for both products and the enterprise platform continues to fire strongly.
I need to do some more work on my valuation of $BRG, as this is one stock I don’t have a good feeling for the likely range around fair value (beyond what the market tells me). I would happily hold a greater weight in my portfolio, but I cannot justify adding at today’s price. The good news (if I can call it that) is that I am almost certain the choppy waters of the global macro-environment together with $BRG’s historical volatility, will present me opportunities to buy more at a better price some time over the next year. It is another case of biding my time and being patient.
Disc: Held in RL (3.3%) not on SM
FY23 NPAT grew in line with sales at 4.2% (2H23 12.4%) after absorbing higher borrowing costs
• Seasonal total cash inflow of $90.9m in 2H23
• Full year cash outflow and an increase in net debt of $117.2m primarily due to acquisition of Lelit, $79.6m, and higher receivables following strong Q4 sales
Grrrrrrrind them coffee beans ..smell the flavour ..yummmmm


5yr Look:

Look No more the Growth is here:


Yesterday I attended the $BRG 1H FY23 results call. In this straw I outline,
- Their reported highlights
- My analysis
- The Market Response
- My Conclusion
Their Reported Highlights
· Sustained EBIT growth of 7.6% against dynamic backdrop
· Record sales half with revenue growing 1.1% and relative geographic Theatre performances in line with expectations – Americas solid growth, APAC steady, and EMEA volatile
· Gross margins well managed and strengthening, despite inflationary pressures and exchange rate volatility
· Operating expenses well controlled and aligned with sales growth
· NPAT and EPS growth tracking overall sales growth after absorption of increased finance costs
· Increase in net debt a function of inventory planning process and the Lelit purchase
· Healthy cash inflow is forecast for 2H23 as receivables are collected and a more predictable supply chain allows a return to a more normal inventory flow model
· ROE return reflects the impact of the Lelit acquisition
· Interim dividend of 15.0c cents per share (100% franked)
CEO Jim Clayton said:
“A solid half of performance for the Group, delivering 7.6% EBIT growth against a challenging and dynamic backdrop. The strength of our product portfolio, coupled with the maturity and agility of our underlying Acceleration Platform, cut through the macro-economic headwinds of the 1H23.
We grew Gross Profit by tacking into our areas of strength: we managed price to counter material input and logistics cost inflation as well as negative currency swings; we leaned on our geographic diversification to deflect the impact of EMEA retailers buying much less than they were selling; we aligned our supply chain and go-to-market to take advantage of the trending tailwinds of "air frying" and “café quality coffee at home”; we executed a much improved new product launch process that accelerated revenue; and, we captured the benefit from the investments we’ve made in our digital execution and geographic expansion.
With Gross Profit growing 3.8%, we then grew EBIT by 7.6%. Over the last 8 years, we have typically, and intentionally, grown revenue faster than EBIT, giving the business model a forward tilt. In the 1H23, as we knocked back the macro-headwinds and retailer purchasing behaviour, we adjusted the business model dials to grow EBIT more quickly than revenue, all while continuing to progress the Acceleration Platform for the years ahead.
I was again impressed by the coordination and alignment across the Breville|Sage team to execute all of this simultaneously. Given the facts on the ground, it was a half well played”.
My Analysis
There was a lot to take in with this result and it shows, yet again, how you have to read through COVID-19 by understanding the trends in the run up to the pandemic, the early phase, the later phase, and then what that means going forward in the context of 1-2 years of higher interest rates crimping consumer demand, particularly for premium $BRG products in a slowing discretionary market.
Revenue and Margins
I was struck by the differences across the three regions: the strength of Americas, the weakness of EMEA, (driven by Europe) with APAC in between. In constant currency terms, America growth of 11.9% more than offset EMEA decline of -19.6%, with APAC flat. Americas (driven by USA) was ahead of retail market sales growth contrasted with Europe materially behind a flatter Europe retail sales growth.
So, why the difference? Jim Clayton observed that although EMEA sales to end customers (“sell out”) was flat, the retailers have run inventories down (thereby reducing “sell-in”), presumably in anticipation of a slowdown and to avoid a lot of working capital. Jim believes that EMEA retailer inventories are now so lean that, even if end customers slow down a little, restocking will be required.
The fact that overall revenue was flat at +1%, show the benefits of $BRGs expanding global footprint.
Of course, the flat sales figures conceal two other significant factors going on beneath the surface, and these were not quantified, so I've tried to back them out.
First, sales include 5 months contribution from the Lelit acquisition. While sales of Lelit have not been disclosed, it was acquired for Eur113 (c. A$170m). So, assuming acquisition at 2 x sales and 5 months’ worth in the result, then the acquisition contributed c. $35m in sales to this half. Second, the “Distribution Segment” declined materially due to disruption to Nespresso units sourced from Ukraine. The decline in the distribution segment of about $28m almost offsets the uplift from Lelit. So, swings and roundabouts.
Despite the flat sales story, $BRG increased prices and so EBIT grew by 7.6%, with %GM expanding to 35.1% from 34.1% in PCP. EBITDA grew by 13.1%. That is an impressive performance indicating that $BRG was able to more than pass on cost increases to customers without impacting sales value.
Inventory
Inventory was a major point of discussion at the FY22 results. $BRG built inventory during FY22 from typically $205-300m to almost $460m, a significant hit to Free Cash Flow. At 30 December, inventory was $465m, so the elevated levels have been maintained but have stabilised. Jim explained that this has been a purposeful strategy, maintaining “just in case” levels against supply chain disruptions. As a result, $BRG has not been impacted significantly by the recent COVID disruptions in China.
Jim indicated that with supply chains normalising and supply chain costs falling, he sees inventories slowly being released to their standard “flow model”. What this means is that if $BRG can hold on to their price increases and market shares, then there is the potential for future margin expansion over H2 FY23.
This will also help the cashflow situation. With the inventory build and Lelit acquisition, net cash has moved to a net debt position of $212m.
The increase in equity to acquire Lelit and sluggish profit growth means that ROE has fallen from 19.7% to 16.1%.
What does it all mean?
With all these moving parts, it is impossible to see the big picture in a 6m PCP comparison. So I have plotted below the last 10 years progression of revenue, operating profit, operating margin and net margin. It tells an interesting story.
Figure 1: $BRG

Source: Morningstar
Pre-pandemic, $BRG drove product range innovation expansion, market entry and bolt-on acquisitions to strongly drive revenue, holding operating margins in the range 11-13% and net margins around 8-9%. Through COVID, they’ve used the inventory build to take market share at a time when customers were buying more goods than services (coffee machines, air fryers etc.).
Expanded inventory, while also maintaining product innovation and new market entry (most recently South Korea and Mexico), put pressure on margins. With plans to now run inventory down as they return to their standard model and having been able to pass on price increases - to what extent will the gains from margin expansion offset the potential of falling volumes, as customers become more price sensitive on discretionary items in a recession?
Having guided to a FY23 EBIT of $165-172m, if we take the midpoint of $168.5m, then assuming a combination of falling input costs and inventory runoff means that we see operating margins return to between 11.5% and 12.0%, that would mean full year revenue (not targeted!) is expected to be in the range of $1400-1460m (compared with $1418m in FY22). Note: The market consensus (with some analyst updates included) have FY Revenue at $1478m and Operating Margin at 11.4%,
Unsurprisingly, this means that $BRG does expect overall flat sales from FY22 to FY23, which is not a surprise given the macro environment. What is encouraging is that price increases already delivered, inventory run-off, and controllable spend in sales and marketing and new product development, provides several levers that enable management to sustain earnings growth and dividend. Jim spoke about how these levers would be managed in H2 to maintain overall profit progression.
Product Launch 2.0
Jim often uses the results to showcase as aspect of the firm’s capabilities. This time, he highlighted the new product launch process: Launch v2.0.
This is a completely new approach to bringing a new product to market. Historically, they would launch at a few outlets in a new country, progressively adding more, building to peak sales over two years. The new approach involves a more focused and compressed inventory build ahead of a country launch, so that there can be a country-wide launch-day, accessible to all outlets, concentrating marketing spend.
The recent launch of Barista Express Impress shown in the presentation compared to the earlier model launched by Launch v 1.0 are dramatic (Figure 2 below) . 60 Weeks from launch Launch V2.0 achieves 2.4x weekly sales, with materially more accumulated sales (difference in area between the two curves). If this is repeatable, then it will lead to a material increase in $BRG’s ability to drive revenue growth and sales and marketing efficiency from new product launches.
Figure 2: Launch V2.0

Source: $BRG Investor Presentation (slide 17)
Where is $BRG headed.
Longer term, Jim sees a return to expanded margins and strong revenue and earnings growth. He argued in the presentation, that COVID has provided a three-year boost, from which he expects to return to the long term trend, enabled by the enhanced launch program. (Figure 3)
Can $BRG achieve that? Who knows. But this is a management team that has competently navigated the impact of COVID on its global markets and complex global supply chains. So I give them the benefit of any doubt.
Figure 3

Source: $BRG Investor Presentation (slide 7)
Market Response
In the two days following the results, SP dropped 9% - partly based on flat sales (a miss) and offset by the better-than-expected gross profit margin. The EMEA hit was a surprise. Today, given the bumper US retail sales results for January, we’ve seen a recovery, so that over three days the SP is off by 2%. Such is the noise of Mr Market.
Overall, brokers have marked $BRG TP down by c. 5%. Part of that, I expect, are their macro-views washing through that - over the last 6 months - probabilities of a recession have increased, particularly for USA.
Figure 4: Broker Response

Source: Broker Reports; FNArena.com
My Conclusion
Overall, this was a good result. Top line sales were a miss to market expectations, but strong margin performance in my view offsets this, and was a beat at the "GM%" level.
$BRG is clearly exposed to the impact of a consumer slow down. But in valuing the company, I prefer to think about the longer term. Thinking beyond a mild recession in FY23 and FY24, the investment thesis for $BRG relies on a belief that they can continue to be at the forefront of kitchen appliance innovation, growing the brand strength in existing markets and leveraging their global supply chain management model to enter new markets, bolting-on selected acquisitions to strengthen the product offering in targeted categories.
Management have navigated the pandemic well, particularly the supply chain disruptions of the last 1-2 years.
In valuation terms, the FY23 forward P/E of 27 is not challenging for a company that clearly aims to return to its strongly historical sales and earnings trajectory. With today’s SP at $21.35 I view $BRG at fair value. Should it be able to navigate the upcoming slowdown and re-establish strong growth, then there is a lot of opportunity for an upside to this.
$BRG is a Hold for me. At 2.7% of my RL portfolio, it is on my list to add either 1) in the event of a significant SP pull-back or 2) if there is evidence of a soft-landing in the macro. Should there be a serious consumer slowdown over the next 12 months, I have no doubt that $BRG SP will fall. However, my response to that situation will be to increase my holding, given my long term view.
Disc: Held in RL
What can Australians do to prepare for power price rises? Is an air fryer the answer? - ABC News

Just saying!
[Not held]
Breville has produced another strong result, revealing a ~29% jump in both revenue and net profit for the first half. This was driven by growth across all segments/geographies.
The company also increased FY EBIT guidance to $136m (~5% lift on earlier guidance), which would represent growth of over 20% on last year.
On a tralining 12-months basis, the EPS is 65.8c, which puts shares on a PE of about 47.
That's quite lofty for a manufacturer of appliances, but then again Breville has recorded some very impressive growth. Per share sales and dividends have grown at a compound annual growth rate of 13% since 2015. There's also lots of scope for continuing growth (something it continues to invest heavily into).
I don't currently hold.

Breville is a business that should be pretty ordinary.
A manufacturer of kitchen appliances -- what is arguably a capital heavy, commodity style business, in a highly competitive global market --- isn't one you'd expect to go well.
But the financial performance has been very impressive over a long period of time for this 88 year old company.
Per share earnings have grown by about 9%pa since 2010, with shares up roughly 4 fold over that period.
Breville has moved into the US (its largest segment) and more recently Europe with great success. 80% of profits come from offshore.
Even during the COVID downturn, the group has delieverd 32% revenue growth between January and April (latest figures).
According to consensus forecast (as per CommSec), EPS is likely to grow at ~10% per year for the next few years.
There's a lot to be said for branding, scale and operating efficency. And there's some strong expectations for continued market share growth.
At the same time, these are largely discretionary goods, and the global economic outlook isnt great. At current prices shares are trading on a PE of over 40, and offering only a 1.5% yield.
So it's hard to dislike the business, but difficult to like the price. In my opinion at least.
