


$IKE issued their quarterly prformance report, with the investor presentation later this morning.
Their Highightls
+ YTD revenue of ~NZ$15.3m (-34% pcp)
+ Subscription revenue of ~NZ$7.9m (+24% vs pcp)
+ Transaction revenue of ~NZ$5.1m (-65% vs pcp).
+ YTD gross margin of ~NZ$8.8m (-28% vs pcp), with a gross margin percentage of ~58% (up from pcp of ~53%).
+ Total cash and receivables as of 31 December 2023 of NZ$15.2m (vs NZ$16.3m at 30 September 2023), comprised of NZ$8.0m cash and NZ$7.2m receivables, with payables of NZ$0.8m and no debt.
My Analysis
Annoyingly, $IKE have stopped issuing the quarterly numbers in the handy KPI report table, only showing the YTD numbers. (I wonder why!) Fortunately, as I track each Q, my spreadsheet backs it out automatically.
Because there is noise in the GM margin numbers as a result of subtracting two small number from each other, I am only going to show the revenue plots. But I think therein lies the clue that we aren't getting full transparency on the quarter.
I've discontinued the number of Enterprise Customers metric, because this metric has now changed to number of Subscription Customers which, to be fair is probably a better metric, but we don't have much history. It's up to 368 from 356 in the PCP (i.e. Q3FY23). +3% in one year is hardly insporing.
As shown below, in summary, no sign of growth returning. (Note, the quarterly numbers for the latest quarter are not reported but backed out from YTD report numbers. So they can be out by +/- $0.2m)
So what is the "stronger period" that CEO Glenn Milnes is referring to? Well the report contains several good contract wins including significant upgrades from existing customers. And, the one bright spot does appear to be a steadily growing base of subscription revenue. This should be getting turbocharged by the new generation software which has a higher subscription cost.
The rest of the release is complicated and trying to tell a positive story about various customers, activity and transaction levels. We'll see.

My Key Takeway
I've posted a lot on $IKE before, and exited the stock early last year on concern that we weren't seeing sustained growth.
I do like to keep track of my "Exits" just in case I was wrong. So far, $IKE is yet to return to growth.
Glenn has turned attention to the cost base, and the burn for the Q was NZ$1,1m, with cash at Dec-31 NZ$15.2m vs $16.3m at Sep-30. If they can hold the cost base flat AND return to growing receipts, then they might just be sustainable.
However, a small cap growth stock it no long appears to me. So I remain out. I'll not be attending the presentation.
Disc: Not held
$IKE has issued it 1H FY24 performance update.
Their Highlights
Revenue 1H FY24 of ~$10.5m (-32% vs pcp).
+ Subscription revenue was ~$5.1m (+24% vs pcp).
+ Transaction revenue was ~$3.7m (-60% vs pcp).
+ Gross margin 1H FY24 of ~$6.2m (-24% vs pcp), reflected in the revenue mix above.
+ Gross margin percentage 1H FY24 of ~59% (up from pcp of ~53%).
+ Cash and receivables as at 30 September 2023 ~$16.3m, comprised of $10.2m cash and $6.1m receivables, with payables of $1.2m and no debt.
My Analysis
It is a while since we heard the term "fortress balance sheet". Cash at $10.2m is down from $13.7m at 1Q and $18.0m at EOFY23 . They continue to burn and, at this rate, will be raising again within a year. The tone has also changed, with the Board now focused on maintaining a healthy balance sheet by "managing costs appropriately."
With the full financials to follow in November, today's report is just the operational KPIs report.
Except its not the standard quarterly KPI report. One key metric, the number of enterprise customers, last reported in 1Q at 394 has been dropped. Let me underscore the signficance of this. This metric has been reported quarterly for the last 10 conseuctive quarters I have been tracking $IKE, perhaps for longer. Therefore, I infer the metric has gone backwards. Of course, the customer concentration issue that has become evident in the last 3 quarters has shown the metric doesn't mean a whole lot. But this is another negative inflection point.
They also don't break out the quarterly numbers anymore (ever since the trend turned negative), so I have provided this below as it can be backed out of the half year numbers easily enough (and my model does this automatically ;-) ).
Figure 1: Quarterly KPI Trends

As predicted in my previous straw on this company, the negative revenue trend has continued, with a further reduction in the number of transactions (i.e. indicative of platform useage). Reasons for this have been exhaustively covered in my earlier straws.
A bright spot, if I can call it that, is that subscription revenues continue to advance, setting a new record of $2,6m for the quarter. Indeed the release focsues on several positive developments with new or expanding customers.
However, to underscore how important transaction revenue is, while subscriptions have slowly grown over the last 5 quarters, total revenue has collapsed from a high point of $8.6m to $4.9m.
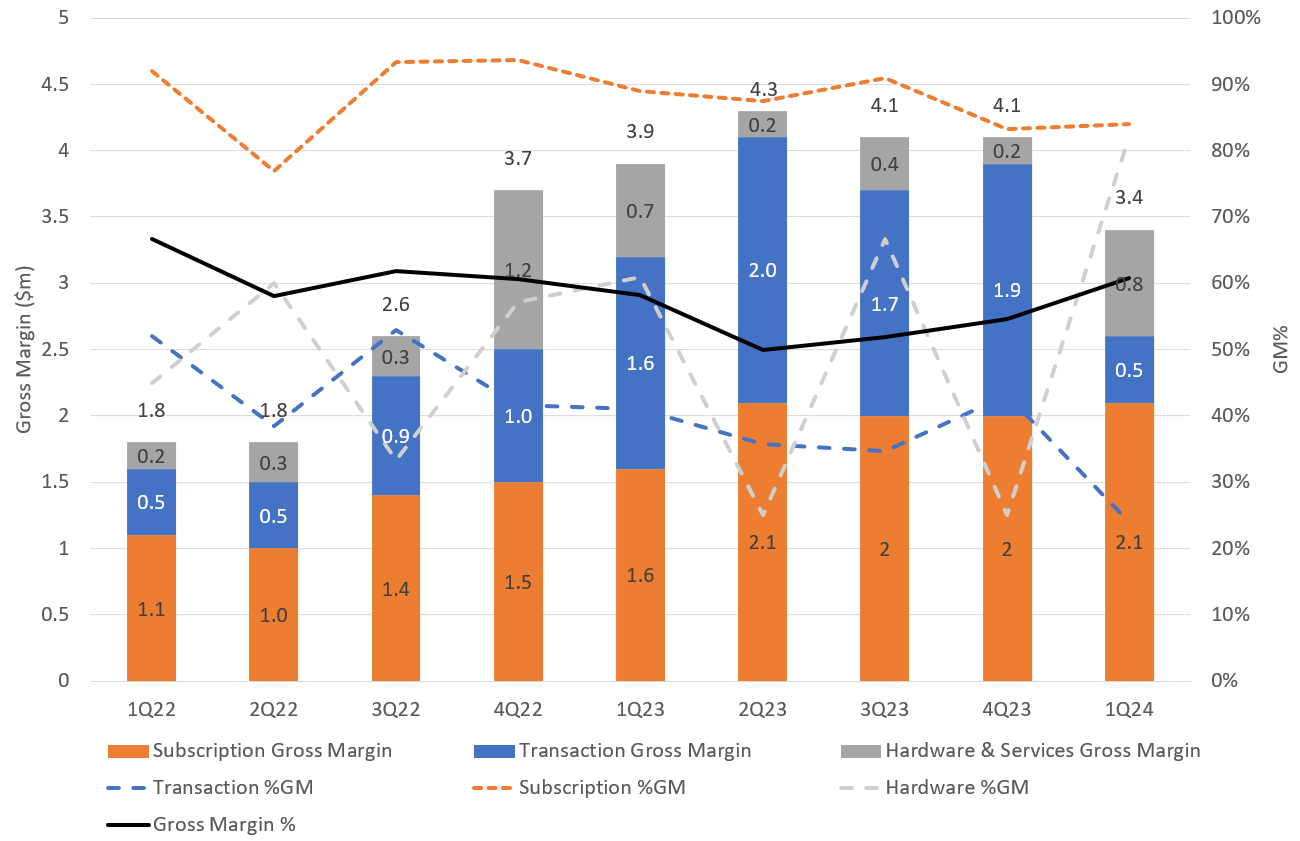
Figure 2: Margins

The margin picture is mixed. Gross Margin decline is dominated by the fall in transactions. While individual %GMs are all over the place, overall %GM is reasonably stable at 57%.
My Key Takeaways
As predicted, this was another weak quarter for platform use. On a positive note, subscriptions continue to grow steadily. New generation Poleforeman is out with previously reported 5x subscription value. But the question is 5x of what portion of the revenue base? I guess we'll see over the coming Qs.
Management continue to change metric reporting if it doesn't suit them. Dropping total customers is another flag. (Decide for yourself what colour, as it doesn't matter to me anymore)
So the big questions is, do the established large customers return to using the platform, as new subscribers build their use over time? And related to this, does this all happen before the company faces yet another need to raise capital?
These are existential questions. Today's release and presentation hold no answers. There is no setting of expectations that transaction revenues are coming back, a further change in the rhetoric that previously assured investors of growth returning in FY24.
I continue to follow $IKE but for now my thesis is that this is interesting tech that adds value to customers but management has so far been unable to turn this into a business.
I continue to watch $IKE, but no longer hold in RL nor SM. Although it was painful to sell and cyrstallise a reasonable loss, I am glad I was driven by my own analysis. History is showing results can get worse and on the SP there is always further to fall.
One potential path is that if the company doesn't renew its trend towards breakeven, the SP will steadily fall as a future capital raising approaches. $IKE then surely becomes an attractive acquisition target. Without the burden of management overhead, there appears to be a valuable tech platform and customer base here for the long term.
It will be interesting to see how this plays out.
Disc: Not held
SUMMARY
Following addresses by Chairman and CEO at today’s AGM, I’ve lost my remaining conviction in $IKE, and this morning gingerly exited my RL position. (I was a little nervous at the open as volumes are very thin, and I consider myself lucky to have gotten a good price,… $0.595 and $0.59, albeit a reasonably hefty loss.)
For those who follow $IKE, I have foreshadowed this decision in previous straws, including my selldown of 50% of my holding following the FY23 results. I’ll not repeat the background in this straw, but rather explain why my thesis is broken.
To summarise, for my thesis to remain intact, I needed to begin to see evidence of a return to growth during FY24. $IKE is a small company, still burning cash, so the level of growth I needed to see coming back was strong growth. I can’t see that growth in prospect and, given that guidance provided in the AGM included new elements of bad news, I am exiting to use the capital elsewhere.
What was Communicated Today
Glenn Milnes provided an update on the FY24 outlook as part of his AGM address today. The key messages are (verbatim from the presentation):
- "Revenue in 1H FY24 is expected to be below analyst expectations due to timing delays of engineering programs across three of IKE’s largest national infrastructure customers. Specifically, this will result in:
- Lower reoccurring transaction revenue in the period vs pcp
- Overall, lower revenue in 1H FY24 vs pcp
- Importantly, the delayed long-term customers referred to are not ‘lost’ and in fact are guiding for very high levels of IKE product usage over the coming future periods
- In addition, the company continues to see ongoing strong growth in recurring subscription revenue vs pcp
- IKE’s additive sales opportunity pipeline supports the potential for substantially increased revenue in the 2H FY24 period, and beyond, from existing customers and new logos"
Covered in previous straws, this is the continuation of less than positive news that began three quarters ago and which the Chairman in his address summarised as follows:
“Looking forward, we expect to see continued overall growth, noting that for Q1 and Q2 FY24 transaction revenue was softer on a run rate level due to the traditional engineering practices of one or two utilities where two larger IKE customers are building their fibre networks.“
That was old news, and the SP and my model have accounted for it. The impact of a reversal of the strong growth from FY22 into early FY23 is clear to see in graph below showing the quarterly numbers. (Note: you can't see this picture when you look at the annual results.) With the sharp reversal of growth over recent quarters it dawned on me that $IKE’s revenues are concentrated in a small number of large customers – something that wasn’t clear to me until these major customers slowed down and it had to be explained.
Figure 1: Trend Analysis from Quarterly Reports

Source: Analysis from $IKE Quarterly Report
So, today’s guidance is more of the same. Now three major customers are experiencing “delays” in their infrastructure programs which, in aggregate, has a material impact on overall forecast company revenue.
What does this likely mean for the numbers?
Glenn makes reference to “analyst forecasts”. What does he mean?
The single analyst covering $IKE currently has FY24 revenue forecast at $38.5m, up 25% over pcp. According to TradingView.com that analyst has a price target of $1.28, and according to marketscreener.com their last revenue revision was an upgrade (!) after the annual results were released – something I cannot get my head around.
I’m not sure who the covering analyst is. Bell Potter had $IKE on their “Picks for 2023” with a price target of $1.21. I also have an old report from Forsyth Barr from September 2022 with a “spot valuation” of $NZ1.07. That old report bears the disclaimer “Forsyth Barr has been engaged and paid by the company covered in this report for ongoing research coverage.”
Whatever the source, the forecast revenue number was perhaps a reasonable estimate given that Glenn had guided investors that growth would resume in FY24. The analyst’s number for 1H FY24 is $17.8m vs $15.4m in the pcp. Following today, that needs to be revised DOWNWARDS, and it will be interesting to see whether it is.
So, Glenn is guiding the market to 1H revenue in the pcp of less than $15.4m, because activity levels at three of $IKE’s largest customers are “delayed”. To soften the blow, Glenn optimistically states that these customers are guiding for “very high levels of IKE product usage over coming future periods.”
So once more, we have bad news on the facts with a promise that things will be better in later periods.
From my perspective, however, what is more concerning is that there isn’t any message that current activity levels have increased from the decline we have already seen over the last three quarters into 1Q24, evident in the graph above.
$IKE claim to have good line of sight into revenues based on the usage of their platform and the deployment plans of their customers.
With $IKE’s 2Q FY24 almost done, I would have thought Glenn would have reassured investors if activity levels were looking more like any of 2Q23, 3Q23 or 4Q23, which they would need to be if the 1HFY24 revenue isn’t going to fall materially below $15m. Now, for full disclosure, I wasnt able to attend the AGM today, and so I don't know what was said in the Q&A. Certainly, transactions and price action indicate that none of the attendees today were spooked. So I may be missing something.
The message of ongoing “strong growth” in recurring subscription revenue is only partial comfort. Here’s why. 1HFY23 subscription revenue was $4.2m. “Ongoing strong growth” would imply to me >30% growth to pcp, meaning that 1HFY24 subscription revenue would be in the region of $5.5m or more, leaving as much as $10m of revenue to find from transaction and hardware revenues to stay flat over the pcp. But that would imply a very strong 2Q24 number for transactions, and there is no message to indicate that this is occurring based on what Glenn is seeing now.
So putting all the pieces together, 1H FY24 revenue might be (and I emphasise MIGHT) significantly below $15m, and I wouldn’t be surprised if it came in anywhere in the range $11-14m.
With closing cash in FY23 of $18 and a cash burn in the year of $7.5m, $IKE isn’t in any immediate need for new capital. However, with costs rising and revenue flat (at best), “Fortress Balance Sheet” has now gone from the lexicon.
On a positive note, $IKE is continuing to add logos, maintaining a rate of about one new enterprise customer per week, and we had the good news of a significant contract of an existing customer moving into a deployment mode and committing to $1.5m of subscription spend over 18 to 24 months. IN addition FY24 will see the launch of the next generation of Poleforeman as well as new versions of AI-powered IKE Insights. Both will drive significant increases in revenue per user.
New customer numbers are good. But more of those 379 enterprise customer on board at the end of FY23, including from many very large utility companies and engineering service companies, need to start using the products, enterprise-wide. Performance cannot continue to rest in the hands of a handful of large customers. Now I know utility network engineers are a conservative bunch in their work practices and I recognise that it may take time for full deployments to be realised. But if that's true, then as an investor it will gradually become apparent over time that the ship is turning, and I will be able to get back onboard.
My Conclusions
I hold small cap, unprofitable companies on SM and RL because their strategy, market position, leadership, and track record indicate they are going to move through the inflection point, on their way to becoming profitable, future industry leaders.
I know it takes many years to build a great company, and that progress is not continuous. Equally, I know most small businesses don’t make it.
$IKE has fallen to the bottom of my merit order, and the loss of conviction has occurred over a 12 month period. I need the capital elsewhere. So, with today’s news I have to exit and I have.
I still believe in the industry opportunity, the product looks like a good one that will drive productivity in its customer organisations, the competition is limited, the management team know their business well.
There is a lot to like about $IKE. It remains a business I would like to own, and I’ll continue to follow it as closely as ever. But I need to see numbers heading in the right direction, and I am happy to sit on the sidelines for a year or some and return if they do.
Disc: Not held in RL; selling on SM
Disclaimer: This is not investment advice. It is a record of a personal investment decision and rationale.
$IKE issued their 1Q FY24 Performance Report this morning.
In May, at the last quarterly update and again at the FY report, $IKE warned of a slowdown in transactions driven by two of their larger customers doing a fibre rollout in an area where the pole owning utility does not allow use of digital tools for the key engineering processes that $IKE delivers. Today we got to see how bad this was. And its bad. I go into this in further detail below.
Their Highlights
- Q1 FY24 revenue of ~$5.6m (-18% vs pcp).
- Subscription revenue of $2.5m (+36% vs pcp)
- Transaction revenue of $2.1m (-45% vs pcp)
- Q1 FY24 gross margin approximately of ~$3.4m (-12% vs pcp), with a gross margin percentage of ~61%. (up from pcp of ~56%)
- Total cash and receivables as at 30 June 2023 of $18.1m, comprised of $13.7m cash and $4.4m receivables, with payables of $1.1m and no debt.
Other key items in the report commentary
First, good news. $IKE continues to add about one enterprise customer per week, so the upward trend in number of customers is steady. Subscription revenue was up slightly over Q4 and +36% on the pcp. So steady growth.
The issue is that transactions and transaction revenue fell dramatically. We knew it would be a decline, but the decline is significant at -45% vs. pcp.
On a positive note, Glenn reports that forecasts coming from customers point to transactions building strongly through the rest of FY24 and that $IKE has not changed their growth outlook from a broader FY24 perspective.
The "soft launch" of next generation software is referred to as a "near term milestone" so it is still ahead of us. What's new is the information that the new features which have been developed in consultation with the customer council are expected to generate subscription revenues of "more than 5 times the level of revenue per annum per customer" than the legacy platform. Wow.
On cash, this is reported at $13.7m.
Trend Analysis
I include my two trend reports. Figure 1 for volumes and revenues and Figure 2 for Gross Margins ($ and %).
Figure 1 Volumes and Revenues
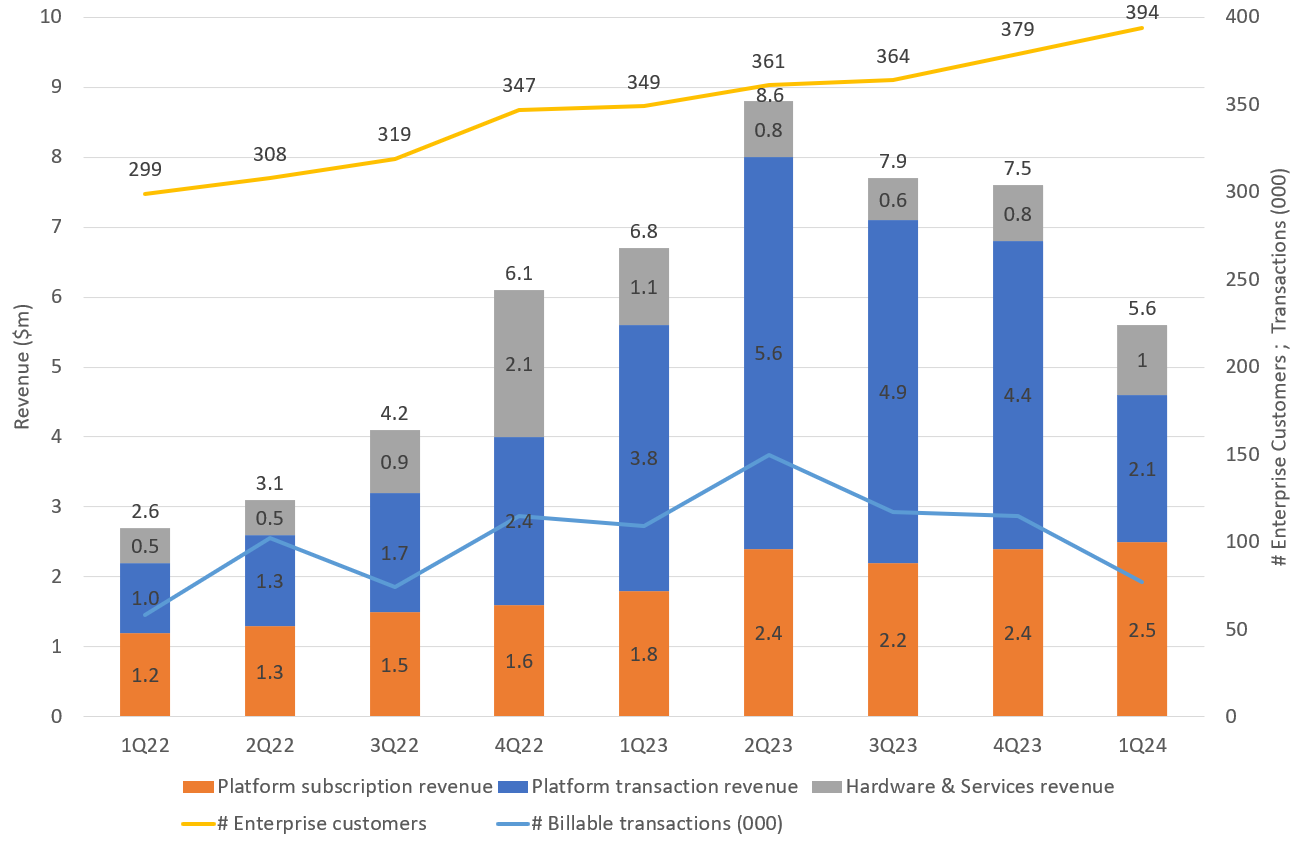
Figure 2 Gross Margin ($ LHS and % RHS)
My Analysis of the Results
Volumes
While we were prepared to expect the decline in transactions, the fall is quite dramatic. It this is down to a loss of activity as two larger customers traversed a "no-go" utility area in their fibrerollout, it points to very high concentration in the subscription revenue.
But what is also clear from Figure 1, is that this wasn't just a one quarter phenomenon. 1Q represents the third consecutive quarter of declining transaction volume. So even though we were given the "heads-up" in May, it looks like this has been a longer time coming, so I have a question as to whether Glenn was being transparent with investors, or only telling us when it became obvious to him that there was no way we were not going to find out.
We are told to now expect growth again moving forward. I'm not surprised that the two engineering customer likely took 3-4 quaters to traverse a State in their fibre rollout (I'll assert this, even though Glenn hasn't said this - just to be clear), what is disappointing is that this implies that growth in the use of the platform across the other almost 400 customers hasn't rapidly compensated for the decline. That says to me that the "super-users" of the platform are highly concentrated.
Reporting the number of customers is an almost meaningless metric. A customer could be a small enginering firm with a handful of engineers, or it could be a large cap utility with 100s or even 1000s of engineers. $IKE would do better by shareholders to report the "number of seats" in the way that $ALU does.
Disappointing though this is, it is not thesis-breaking from my perspective for two reasons. First, in the short term, the two super-user customers will move to other juridictions and begin to use the $IKE tools again. This appears to be forecast. Secondly, and more importantly, provided that other customers are rolling out the use of the $IKE tools, then over time, this lumpiness will smooth out.
As ever, we can either choose to accept Glenn at his word or not, that growth will resume for the rest of FY24. Historically, Glenn has a good track record on forward-looking statements, so I will give benefit of the doubt.
Margins
Margins collpased in transactions. It is unclear how costs are allocated to transactions. Unlike normal SaaS where the incremental transaction cost is $0, we know that $IKE provides services in support of the use of the tools. Given the collapse in volumes, some of these support resources are potentially being recovered over a smaller volume.
More generally, margins appear to not be a concern, as the overall % GM has continued the postive trend up over the last 3 quarters getting back to where is was in 2022.
Cash
Cash has fallen from $18.0m at the end of FY23 to $13.7m at the end of Q1, and Glenn has dropped the use of the term "fortress balance sheet". From my perspective, that puts $IKE on a "negative watch" because, were this rate of burn to continue, $IKE would be only two or three quarters away from raising cash. However, if growth resumes through the rest of FY24, then the propsect of a raising might be averted.
Outlook
The forward guidance is clear about a return to growth, both from transactions and with the propsect of strong subscription revenue growth as the next generation software is released and progressively adopted through the rest of FY24. This will be a key proving point for $IKE. If customers value the new product and adopt it, subscription revenue will grow strongly and - given the value to customers - you'd expect transaction volumes to follow. If not, $IKE could face the prospect of supporting customer on mutliple platforms, which could potentially drive costs. So it will be an interesting year or two ahead!
My Key Takeaways
The result is disappointing and it raises (or rather strengthens) questions over the longer term trajectory for $IKE. Frankly, it is worse than I feared, but it is not inconsistent with what Glenn has said. I believe we could have been warned earlier and you could debate whether Glenn should have done this, if he could.
In May, given the negative outlook and my concern about customer concentration risk, I cut my $IKE position in half, as I was too overweight for such a high-risk proposition.
The $IKE SP can be volatile given illiquidity. So if any shareholders weren't paying attention in May and June, they might get a nasty shock this morning. We'll see as the day unfolds.
Unless anything material transpires in the call at midday, I intend to sit tight with my current position. Indeed, if $IKE can maintain subscription growth and restore strong transaction growth, then given all the reasons I've written about before, I'd like to hold more of this stock. It is possible an adverse market reaction could give me an opportunity to pick up more cheaply in the near term. However, I have to be honest and say I do have questionmarks now, and my conviction in the thesis is not as strong as a year ago.
For now, I'll sit tight whatever Mr Market decides.
Disc. Held in RL (1.3%) and SM
My straw yesterday reported on the results call. From this I noted a flattening of performance in H2 compared with H1, and we also heard from CEO Glenn that platform transaction growth would likely be lower in Q1FY24 than Q4FY23. Because of this, I have taken a bit of a dive into the quarterly data for FY22 and FY23. I will also comment further on risks around the FY23 financials, expanding on my response to question from @Vandelay yesterday. As usual, I end with some important key takeaways.
Annual Performance
Let's start with annual numbers for FY21, FY22 and FY23: Figure 1 shows revenues, customers and transactions and Figure 2 shows Gross Margin.
Figure 1: Annual Revenue, #Customers and # Billable Transactions (000)

Figure 2: Annual Gross Margins

Overall, pretty impressive growth. Revenue CAGR is 82% and GM CAGR is 67%. So far, so good. Importantly, we can clearly see that the strategically unimportant Hardware and Services are becoming less significant, while the Transaction Revenue is becoming a major revenue driver while also making a major margin contribution.
There's been some discussion here about declining %GMs: 64% (FY21), 62% (FY22) and 53% (FY23), although within this I have noted that H1 FY23 was 53% and H2 FY23 was 54%, so it may have bottomed out - but one to keep an eye on.
Figures 1 and 2 also shows over the last two years, more customers are on contracts with a transaction component and/or customers are using the platform a lot more - frankly, over 2 years transaction revenue has exploded. If this continues with large enterprise customers, then perhaps we will see the strong net revenue retention shown by SaaS firms like $ALU and $WTC, where existing customers grow strongly for several years as the platform is adopted and integrated by more team (departments / geographies) into work flows. That's a core part of the thesis.
So far, all so good. But now let's look at the quarterly performance.
Quarterly Performance
Figures 3 and 4 show the same KPIs broken down on a quarterly basis. The picture is (obviously) the same in aggregate, but it raises an important question. (Note these pictures are less flattering because we don't have the full quarterly breakdown for FY21, as the information has only been reported consistently for the last two years. So only FY22 and FY23 are shown.)
Figure 3. Quarterly Revenue, #Customers and # Billable Transactions (000)

Figure 4: Quaterly Gross Margins

When looked at on a quarterly basis, it is clear that revenues and margins have been flat and/or in decline for the last three quarters.
More significantly, even though Glenn reported that Transaction Revenues in 1Q FY24 are expected to be lower than 4Q FY23, what he omitted to point out is that transaction volumes, revenues and margins have already been declining since 2Q FY23!
This wasn't immediately apparent from the report and presentation, because the quarterly data isn't presented in an easy-to-read format, You have to break it out across the reports.
If, as Glenn reports, transaction volumes are lower in 1Q FY24 than 4Q FY23, then that would represent 4 consecutive quarters of decline. This is at odds with aspects of the core thesis: that customers number are growing (true), that customer capex and therefore engineering work is growing (true - 5G, Broadband, Electricity distribution ... you can see it in the annual reports of the major US utilities), and that customers are increasingly using the platform to deliver work more efficiently and that over time, large customers are rolling it out (in question).
Now we know that growth is not linear, and that progress ebbs and flows, and that data can be lumpy from one quarter to the next.
We also know (from yesterday's call) that some customers will not be able to use the $IKE platform in all geographies, depending on the policy of the owner of the poles, and more specifically, that two major customers are currently working in areas where this is impacting utilisation.
But it raises a question-mark - and it is something to keep an eye in future reports.
FY23 Financials
I wanted to conclude with a further comment on FY23 financials, as I gave a "first pass" response to @Vandelay yesterday.
For this, consider the 1H FY23 P&L in Figure 5.
Figure 5: 1H FY23 $IKE P&L

Let's go through line by line and see if we can scope out a directional forecast for 2H FY23! Some items are impossible to forecast, but I'll comment on those that can be.
GM is slightly better at 54% although revenue is slightly down. So let's say GM is flat at $8.2m.
FX was +$2.2m in 1H. Having looked at NZD and USD rates and cash balances, I forecast this to be -$0.8m to -$1.2m for 2H.
On expenses, Ian said on the call that costs are being controlled well. However, he also indicated that $IKE are continuing to invest heavily in the product and the supporting systems. He spent quite a bit of time on the call detailing this, even adding a slide that was in the ASX release! In addition, all the staff in the Expense item are subject to wage pressures, so it we modestly assume a 5% step up in expenses in the half, that would add -$0.6m. I could be wrong on this, if more of the staff effort on development has been capitalised.
Bottom line, it is easy to see negative pressure of $3-4m on the P&L while we know that GM is flat, half on half.
Given that Net Income was $1.1m in 1H, that would point to the result for the FY leaning towards a $2-3m loss.
This could be swung either way by those line items that we cannot predict, so my window for the result is $0m to -$5m, which compares with a loss in FY22 of -$7.86m.
So, in answer to @Vandelay , no, I don't think $IKE will post a profit in FY23.
And neither does the market. The consensus (n=2) is for a -$3.54m loss, which agrees with my result.
In short, I don't think there'll be any positive surprises in a few weeks time.
My Key Takeaways
As I have said, $IKE is my highest conviction, small cap. Until today, I had been holding a "double allocation" compared with what I normally hold for high risk holdings.
The analysis I have laid out today and the insights from the call yesterday don't change my overall view of the investment thesis, and my view that I believe that, over the LONG TERM, $IKE will be a profitable and much more material business.
It is also the kind of business that is very likely to be acquired by the large corporates providing technology solutions to utilities (think Siemens, ABB, Mitsubishi etc.). The reputation it is building in the space and its blue chip client list makes this very likely, in my view.
However, the lesson I have learned over the last 3 years in holding high risk, unprofitable businesses, it that I have suffered outsized losses mainly due to failing to manage position size. By this I mean, I have at times confused getting to know a company with getting caught up in the story and not properly evaluating the risks and adjusting over time, ahead of the market telling me what I really already knew!
I believe the immediacy and quantum of the growth trajectory is today more of a risk, standing here in FY24 than it was in FY22 and even 1H FY23.
Adding to my assessment of risk, is that I feel that $IKE could more clearly communicate their results. The quarterly KPI data is all there, its really good, and I hope they stick to it. It's just that you have to do some unnecessary analysis yourself to extract the full picture.
In addition, by no longer reporting New Contract Sales or TCV, investors are losing some forward visibility. I said yesterday that I support this decision for reasons set out in yesterday's straw. However, $IKE also do not report churn or net revenue retention, so investors do not have visibility that other SaaS companies provide into the quality of their revenues.
In the same vein, the number of customers metric is almost meaningless. An engineering firm of 50 engineers counts that same as a $100bn cap utility with thousands of engineers. Yesterday's narrative on transaction revenues indicates that customer concentration may be more of an issue than is apparent.
As a result, I have halved my RL position in $IKE from 3.0% to 1.5%. (And will make a proportionate adjustment today in SM.)
I look forward to being able to increase position size when growth trajectory and profiability are confirmed. In this decision, I am prepared to give up some upside as the price of securing that option.
Disc: Held SM and RL
IKE issued its Q4 and FY23 performance update today. In this straw I cover:
- Their key highlights
- Insights from the presentation and the Q&A discussion
- My key takeaways
Overall, Q4 brought home a very strong result for FY23.
Their Key Highlights
- FY24 revenue of ~$30.8m (+93% vs pcp)
o ~$6m ahead of internal budgets set at the beginning of the financial year and above upgraded analyst consensus.
o FY23 gross margin approx. ~$16.4m (+67% vs pcp), with a gross margin percentage of ~53%.
- Total cash and receivables as at 31 March 2023 of $23.2m, comprised of $18m cash and $5.2m receivables, with payables of $2.3m and no debt.
Figure 1: Revenue Performance

Figure 2: Key Metrics

Insights from the Presentation and Q&A Discussion
1. Revenue and Margins
Overall, Q4 finished off a very strong year above both internal management “stretch targets” and analyst views. Q4 contributed $7.5m of revenue to take the unaudited total for the year to $30.8m.
While Q4 was slightly softer on revenue than Q3 ($7.9m), a stronger %GM performance meant that Q3 and Q4 each contributed a GM of $4.1m, taking GM for the year to $16.4m, up 66% on FY22.
I’ll write a separate straw providing a detailed analysis quarter by quarter across each of the segments over the last two years. However, the good news is this will show that the concerns raised in this forum about weakening %GM performance over time appear to have stabilised from 1H to 2H of FY23, even if we aren’t yet into margin expansion. That lies ahead, given some of the investments being made and discussed below.
Importantly, 89% of revenue now comes from “recurring and re-occurring revenue” – subscriptions and transactions.
2. Cash
Although $IKE don’t report a quarterly 4C, the total of cash, cash equivalents and receivables were essentially unchanged from Q3.
Given a slight weakening of the NZD vs. USD over Q3, I estimate they gained a small FX benefit. Because of this, I estimate they were once again mildly OpCF positive and mildly FCF negative for the half, due to ongoing investment in the platform focused on IKE Insight, development of next generation of Pole Foreman, and building out core business systems (See below).
We’ll get a proper look when the financials are released in a few weeks’ time and we can back out H2 cashflows, however, cash burn for FY23 is very significantly reduced from FY22 (-$10.6m) and by my estimate likely to be in the range –($3.5-5.0)m, given the -$1.8m FCF (or -$2.0m including lease payments) in 1H and the even split of margin between 1H and 2H.
I tried to draw Glenn on how they are thinking about FY24 cash generation, however, as expected he refused to give guidance on cash flow. He said: “we keep a close eye and engagement on analyst consensus, and we’re quite comfortable with where they sit at the moment.” (Note: According to marketscreener.com, based on the one analyst that provides a FCF outlook, they have $IKE at -$4.5m (FY23), -$1.30m (FY24) and +$2.90m (FY25).)
Overall, $IKE maintain a strong balance sheet to continue to build the platform, increase automation, and embed themselves in their customer workflows, without a need for further capital. As subscription and transaction revenues grow, they can if they choose transition to the point where future growth could be supported out of operating cash flowsby managing the rate of investment in platform development.
3. Market Update (slide 10)
Glenn indicated that while the tailwinds of broadband and 5G buildouts are key in the next 3-5 years and are well understood, the biggest and most rapid change in the market is the required investment in the electricity grid where the energy transition will see the grid grow from providing 20% of US energy to around 50%. Importantly, this is a multi-decadal shift out to 2050. Glenn summarised $IKE’s position as simply being in the right place at the right time, as much of this investment will be focused on the distribution – adding “capacity and stability to the grid”.
4. New Sales
Glenn reported that they are going to stop reporting new contract wins and renewals. The primary reason for this is that many of their customers who have embedded the product in their workflows are no longer taking out long term contracts and are now being billed on a monthly basis according to licences (seats) and usage (transactions).
Being the suspicious type, I wondered if this was a convenient time to make the transition – being potentially a softer quarter. (I’m still troubled by Ian’s behaviour at $3DP!) Glenn was challenged on this in the Q&A, and he repeated his stance.
Throughout the presentation and discussion some further information relevant to this, and the success $IKE continues to have, was obtained.
1. Glenn said the sales team are working well, closing on average “one new enterprise customer per week”. He showed a slide on the sales team organisation, which has dedicated resources focused both on winning new customers, but then also on customer success and expanding use within accounts. They are following a strictly direct to market strategy (good!) and following a clear priority order based on customer size.
2. He repeated information stated at the ASX Conference earlier in the year, that they have recently won one of the large ("top 5") East Coast publicly-owned utilities from a competitor. According to Glenn, the competitor product had been used by the utility for around 20 years – showing how sticky utility customers are. So, a good win for $IKE. More on that below.
3. Engineering Service providers: These have huge significance in supporting the utilities and often have decades long contracts doing the network development and maintenance work. $IKE have just won the “second largest engineering group in the USA in terms of customer footprint across utilities”. They are starting in New Mexico on a big, 10-year project and $IKE hope to be successful there, so that they get rolled out across the entire organisation, which will “take time”.
Overall, even if this might have been a convenient quarter to make the reporting change, the change makes sense. For now, the quarterly operational updates give investors great transparency on revenue by type (transaction, subscription, product/service) and customer numbers. And with transaction volumes becoming a dominant revenue component, it makes no sense for customers to lock in defined volumes when their contract sees them being billed on a monthly basis based on usage. (I think Glenn has been smart to drop the TCV metric to avoid getting into the pickle that Ian is facing at $3DP.)
5.System Investments (slide not in ASX release)
For some reason, the below slide wasn’t in the ASX release, and Glenn spent several minutes speaking to this.

On System Efficiency, this is all about scalability and operating leverage via investing in core systems (“unglamorous stuff"). This was new information, and he described the system investments $IKE has been making so that they can scale the business efficiently in finance, HR and staff development, marketing/CRM. He also spoke about the substantial SOC2 compliance investments were proving important in customer procurement decisions (“IT departments now just tick that we are SOC2 compliant.”).
The points on Brand and CX have been made previously, albeit not directly linked to driving pricing power.
Glenn went on to say that “when you look at our P&L, you will see that we are investing very substantially in product and technology investment. We are still small and early in penetrating the market, but we’ve got a good view into what our customers require.” I took that as potentially preparing the market for a larger Research and Engineering Expense in H2. This item has been trending up over the last three halves as follows: $3.2m, $3.3m, and $3.9m. (So, if it has moved up again then it will move FCF to the lower end of my estimated range (or beyond?). Even if this cost is increased, given the traction $IKE is getting with its customers, I am happy for this to be the case – now is the time to lock in customers for the next 2-3 decades of growth.
Pole Foreman: A key focus for investment has been the next generation of Pole Foreman, and Glenn spoke about the early positive feedback they are getting from the Customer Council. “We believe it can be quite disruptive versus competition.” Glenn linked this to a key reason for flipping “one of the top 5 investor owned utilities” to $IKE from an incumbent providers, starting with a 100 user licence for 3 years. (See section 6 below.)
AI and Automation: Glenn referred to a small AI acquisition they’d made and said they have been working for two years on using generative AI for poles. He indicated that they are getting some very interesting proof points, and are just coming to market with one of the “world’s largest digital data collection companies” as their pole or distribution asset partner. “This is exciting because it lets us access data at real scale and potentially bring some quite disruptive automation capability into the North American market.” (Note to self: look out for more information flow about this.) (Further note: previously Glenn had spoken about collaborating with $3DP in WA with a utility, but it sounds like they are moving ahead commercially with another partner, as $3DP doesn’t fit the descriptor of “one of the world’s largest digital data collection companies”.)
Glenn concluded the section on product and tech investments by saying that none of these things happen very quickly, but that they are very optimistic about them from a proof point perspective.
6. Why Customers Switch to $IKE
I asked Glenn if he could explain why the latest large utility customer had switched to $IKE from their legacy provider. Glenn replied that it certainly wasn’t because of price! (chuckled) The deal winner was the user experience and simplicity of using the $IKE platform. He said that when a utility has 500 engineers using a product, then simplicity is important. He said that the competitor product is great, its just complicated to use.
7. Customer Council (Slide 33)
Glenn spoke again about how important the Customer Council is in guiding the development of the next generation of Pole Foreman. The slide shows some of the huge utility companies on the Council. The new information Glenn gave is that the people involved on the council are the senior people responsible for setting standards in the utilities. Essentially, by doing this $IKE is developing their product to meet customer requirements for the evolving standards in the industry, a huge competitive advantage when procurement decisions arise.
8. Non-Exec Director Resignation
In Q&A there was a request for more information about the resignation of Eileen Healy US Telco Non-Exec Director after only two years. I'll paraphrase Ian's response:
“She’s been a very valuable board member but a mutual view just looking at the skills we’ve acquired to get to where we are … and where we’re going … and some other personal components as well … our intention is to keep building capability from a Board perspective … there is a really interesting pipeline of potential candidates but nothing imminent.”
Take from that what you will, but one interpretation would be that with things such as a powerful customer council of current decision-makers in the big utilities, perhaps the Non-Exec found they weren't adding that much value or perhaps are not current with the huge trends sweeping through utility USA. Who knows. In any event, I don't see any evidence of flags to raise of any colour.
9. Guidance
While there was no overall guidance today, Glenn flagged in the release and in the presentation that:
"We expect growth to continue in FY24, noting the potential for Q1 FY24 transaction revenue to be below the Q4 FY23 run rate because of the engineering practices of utilities in certain territories where one or two larger IKE customers are building fiber networks."
Because transaction revenues exploded from $6.4m in FY22 to $18.7m in FY23, any step back in Q1 FY24 will now have a significant impact on overall revenues. So, I wanted to dig into this in the Q&A asking what drove seasonality of revenue.
Glenn's response was as follows: "Seasonality - yes there are two parts."
"First we support people that are building and maintaining outside power and communication networks that are above ground, so that when there are big storm events, folk cannot get outside and do engineering so that slows down activity which impacts us."
"Second part of that question, ... in our update today we talked about some transaction revenue potentially slowing down through Q1 FY24. That context is different. We support a range of national communications companies that are building fibre in different markets. They're all in a race to build a fibre network in a city and then switch on the network and win customers. A couple of these customers that we support are in territories where the utility that has to support their network build-out have relatively old-fashioned engineering standards in terms of how they will approve data. And we as a digital standard don't fit those particular requirements in Kansas and in [some] other states. These groups will go to many, many other markets through the year so we may just see things slow down from a recognised revenue standpoint."
I thought this was a very insightful answer. It means that if $IKE's customer is a utility that relies on an electrical utility for access to poles, then that party needs to accept the use of the $IKE platform (presumably from an engineering standards perspective). This will definitely be the case for the broadband and 5G customers, as the poles are usually owned by electrical utilities.
Secondly, for the situtation at two customers to potentially materially impact quarterly revenue, this must mean that a significant proportion of transaction revenues is likely currently still concentrated in a relatively small number of "super-user" customers (my words). This doesn't worry me, because over time, this effect should become less of a problem as $IKE is adopted by more and more customers. But when your total annual revenue is still only $30m, a small number of "super-users" can impact revenue volatilty, so it is important to understand that and to be prepared for future volatility.
My Key Take Aways
Overall, this was another good result.
It I wanted to focus on any negatives, it would be that growth has flattened in H2 compared with H1. But given that 1H was such a massive step up from FY22, then it is good that it has at least been repeated for a second half. Quarters and halves will be variable, hence my next straw to quantify this more explicitly.
I got a lot more out of the presentation and Q&A, and I continue to appreciate Ian's candour in answering questions, even if his organisation and presentation of material would benefit from improvement to ensure consistent messages are communicated to all investors!
$IKE is tracking well and today's presentation was a good setup for the FY Financials in a few weeks time.
My current holding in $IKE (RL 3%, 10% SM) is supersized for such a small, high-risk and unprofitable company (double what I normally hold due to my strong conviction). I didn't see anything in today's presentation that makes me want to change that position either way. My criteria to increase position size are 1) for $IKE to be sustainably profitable, and 2) growing strong year-on-year revenues and operating cash flows. For now, I am content to hold.
With a valuation of c. 4.4x revenue, today's SP seems justified given the 93% revenue growth of the last last year. However, $IKE needs to sustain strong revenue growth into FY24 and demonstrate margin expansion and operating leverage. Any valuation beyond what we have today is pure guesswork.
For now, none of my other small cap holdings are showing the promise that $IKE has demonstrated in FY23, so I am a happy HOLD.
Disc: Held
@JPPicard has summarised the key issues for $IKE perfectly (from my perspective), and his deep-dive is an excellent introduction and outline of the firm. I'd like to add to this information as part of getting my own "eye in" for the forthcoming results.
If $IKE are true to form, there should be a Q4 Performance Update in about 10 days time, followed by the Annual Results towards the end of May (as IKE follows a 31 March Year End cycle).
I've included two trend analyses on recent half-year results which further underscore just how important the next HY/FY will be, and I also make an observation on revenue growth.
Revenue Growth
The last 3 HY results have shown explosive revenue growth, as existing customers have rolled out the platform, new customers have been added, and platform transaction revenue has started to make a material contribution (see Figure 1, below).
CEO Glenn Milnes has regularly pointed out the linkage between Recognised Revenue and Contracted Revenue, with the former consistently lagging the latter by about 9-months.
On that basis, we should expect to see a softening in (edit: deleted "contracted") recognised revenue growth - and perhaps that has played into the SP weakness over recent weeks as this is anticipated (SP down 20%+ since February's peak), although a selling down by insiders/major holders may be a more inportant factor here in a stock that is usually quite thinly traded (see further down in this Straw).
If the investment thesis is that utilities roll this out and increasingly use it on an ongoing basis, and if more engineers are using the platform over time, then it must follow that platform revenues build progressively over time, extending the strong recent trend. So, if we have seen a weakness in new contracted revenue, this should reveal just how strong the underlying usage by existing customers really is, and provide some first insights into the quality of the business. A potential moment of truth.
The good news is that Glenn usually gives clear updates on Contracted and Recognised Revenues by quarter at each Quarterly Performance Update, as well as reporting Transaction Revenues. (I'll be on the alert for any evidence of Ian-Olson-itis! Sorry, $3DP-holders - I couldn't resist.)
Margins
As @JPPicard has highlighted, the next insights on GM are key. As you can see in Figure 1, while the trends for financials (GP and PBT) are generally favourable, piror to the last HY result, the OpCF (incl. lease payments) trend was not good. However, there was a strong uptick in OpCF the last HY, and the key question is whether this is the start of a positive trend that takes $IKE through the inflection point?
The positive trend in FCF is already establised over four recent HY periods because the heavy lifting in building the product suite has moved onto a new phase and Glenn has been focused on conserving cash. R&E activity is now focused on developing automations for the repeat service requests coming in via the IKE Insights product, and on developing functionality that can support increased customer value captured through price increases.
Figure 2 shows that the businiess appears to be scaling well at the Expense line (S&M and R&E as % of Revenue), but GM% is a question mark (i.e., Cost of Revenue as % Revenue). We need to see that flatten and then decline to have confidence the business is scalable.
Figure 1

Source: HY and Annual Accounts
Figure 2

Source: HY and Annual Accounts
Figure 3

Source: Q3 FY23 Performance Update Presentation
Newsflow
Newsflow since the last results has been minimal, with flags raised through sell-downs of two important holders.
1. New Logo Wins
Glenn slipped into the ASX Small and Mid Cap Conference presentation that $IKE has won a large East Coast Electrical Utility off a competitor, taking $IKE from having 5/10 to 6/10 of the largest investor-owned utilities as customers in the US. This didn't lead to a formal ASX announcement, so that might indicate that the initial contract was not material. However, unlike many firms, $IKE tend not to announce every major contract and prefer instead to provide updates as part of the Quartlerly Performance Reports. Equally, initial contracts can be small, as customers trial the product in one department or team before commiting to a roll-out. I expect we will hear more about this in 10 days' time.
2. Changes in Insider and Major Holdings
CEO Glenn sold about 24% of his holding just as shares had come of their peak in February. Glenn was not a major holder - owning less than 1% prior to his sell down. However, this is an orange flag, when paired with the plateau in closed contracts above. This has weighed quite heavily on my level of conviction, simply because $IKE is at the inflection point, and if it blasts through that, it might reasonably expect a SP re-rating. I couldn't imagine selling 24% of my holding if I thought continued strong progress was likely, but I might if I expected a softer result and/or needed the cash and/or wanted to manage my overall exposure (which is exactly what I have done years ago as an insider!).
NZX notifications are somewhat different to ASX, so I did some digging and found that one of the four major shareholders, the Douglas Family Trust (and related entities) also sold down from an 8.7% holding to a 6.11% holding in February. (I'm not sure who this entity is, but I think they may be related to Kevin Douglas, founder of Douglas Telecommunications and a Non-Exec of IMAX Corp in the US.)
On the other hand, I am encouraged that Chairman Alex Knowles who holds 7.2% has not sold down and neither has the largest shareholder David Jonathan Wilson at 16.8%. (David, from his Twitter profile and other information, is a NZ tech investor who has followed Xero over the years and was - until 2019 - a top 20 Xero shareholder.)
Key TakeAways
$IKE is my strongest conviction small cap / v high risk / high growth holdings. The upcoming reports - and what they say about the performance over the last 6 months - have the potential to re-set my ongoing level of conviction. If growth continues and GM starts to expand, then I'd consider adding some in RL. If it is a softer result, then my conviction will be dialled back.
Of course, while it is important not to be overly fixated on one result, in this straw I have laid out the case for the extent to which these next reports can either help dispel remaining question-marks or, equally, cast into doubt just how good this business can be.
Disc. Held IRL (2.7%) and SM (10.4%)
Just finished listening to Glenn Milnes presenting on $IKE at the ASK Small and Mid Cap Conference.
A couple of nuggets in what he said, in the Q&A:
- Over the last 24 hours $IKE has just won a large East Coast Electical Utility from of one of their three main competitors. This is a significant milestone, taking $IKE from having 5 of the 10 largest US Investor-owned utilities, to now having 6 of the 10 largest.
- The second news item is that the NextGen Poleforeman product, which has been developed in consultation with their Customer Council(see below) and which will be released later this year, has been pre-sold to several existing customers. Glenn noted that due to it enhanced features and functionality, that it will be a higher margin product.
Two gems worth tuning in for.
No further news on results trajectory.
Next update will be the quarterly performance call in a few weeks.
Disc: Held IRL and SM

$IKE provided their regular Q3 performance update today and I attended the call this afternoon with Glenn Milnes.
Their Highlights:
+ YTD revenue of ~$23.3m (+134% vs pcp) + Q3 FY23 revenue of ~$7.9m (+88% vs pcp)
+ Q3 FY23 recurring subscription and reoccurring transaction revenue of ~$7.2m (+121% vs pcp).
+ New contracts closed in Q3 FY23 of $7.3m
+ YTD gross margin approximately of ~$12.3m (+98% vs pcp), with a YTD gross margin percentage of approximately 53%.
+ Total cash and receivables as at 31 December 2022 of ~$23.5m, comprised of $20.6m cash and $3.0m receivables, with payables of $1.8m and no debt.
My Assessment:
KPI Report
I have taken their PCP YTD 9 months KPI report and added the previous PCP period, because it is important to understand how the business is evolving over a longer term, because the picture is very helpful.
Figure 1: Analysis of the YTD 3Q FY23 and YTD 3Q FY22 KPI Reports

From FY21 to FY22 we started to see the rapid growth in platform usage off a very small base, particularly by larger customers. Although usage growth in the latest period has moderated to (only!) +60%, the lagging revenues have started to come through strongly, with platform revenues up +258% in the latest report, compared with (only!) +135% in 9m FY21 to FY22.
A similar story can be seen with subscriptions. Even though subscriber growth is steady at +14% (vs +15% 9m FY21 to FY22), subscription revenue growth has accelerated from +14% to +60%, and Platform Subscription Gross Margin from +6% to +63% in the latest report.
Hardware sales are becoming less significant. But even here Gross Margin growth accelerated from +60% to +63%, with %GM indicating that cost increases are being passed on to customers.
Overall, the KPI report shows continued strong growth, with strong acceleration in transaction revenues a highlight.
% Gross Margin
As @shivrak k and I have discussed over the months, the overall trend in %GM is a question mark. Overall %GM at 53% appears to have stabilised from 1H (53%), after declining significantly from FY21 and FY22.
I took the chance on the call today to ask Glenn about this. Glenn responded by explaining that customers are increasingly requesting analytical services from IKE on their datasets, which is provided through the ikeINSIGHTS platform. Glenn explained that at the moment this is labour intensive and in high demand. Glenn said hat they are investing heavily in automating the required analysis, and over time he is confident that this process will become more efficient and the %GM will increase.
So, this is a good answer and something that we can now track over coming periods.
Cash Burn
I asked about the large $5.1 million cash burn from end of 1H. Cash is now $20.6m from $25.6m. Glenn confirmed that a “very significant” part of this was due to the appreciation of the NZD to the USD that occurred from end September until end December. (My calculation is that as much as 60-80% of the “burn” could be FX-related, but we’ll see in 3 months time.)
Pipeline and Progress in January
IKE currently have 5 of 10 of the top electricity utilities in the US as customers. They have numbers 1, 3 and 5, and the sales teams are working hard at numbers 2 and 4.
Glenn reported that they have “Sold well through January, and delivered well too, so feeling good for Q4”.
The Market Opportunity
There is a lot of material in the presentation about the US market opportunity. I won’t go through this as it is evident to everyone who is following the US macro-picture. What Glenn conveyed is the massive challenge Electric Utilities and Telcos are facing given the need to invest in the grid (after years of underinvestment), the energy transition, broadband rollout and 5G and their ageing workforces due to industry demographics.
He talked about how even the smallest municipal utilities have a relentless programme of investment for years to come. Its recession-proof, and most are regulated.
On the sales cycles he said that utilities are the slowest (longest cycle), telcos are faster (but “deliberate”), and the engineering firms are fastest (some “within a week”).
The overall market is at the early stages of penetration.
My Takeaways
IKE continues to grow strongly. Based on today’s progress, by my analysis I expect FY revenue of $31-34m, which would be >100% growth over the year, an acceleration from FY22 vs FY21 which was +71%.
Margins appear under control, so we should start to see ongoing evidence of operating leverage as expenses as % revenue continue to track down.
There has been quite a bit of FX noise muddying the cashflow story in the recent reports (up and down), so we have to wait for the FY results to see a clear CF story. However, it sounds like the underlying cash burn is modest. In any event, they need to invest now in the platform to maximise automation and deliver value-added features for customers which will result in increased pricing.
I am convinced by some of the questions on the investor call that the market is still not paying close attention to IKE. (Some of the questions on the call indicated they even those who are, lack understanding of the business.) I toyed with the idea of increasing my holding, but this is still a high risk proposition and at 3% of the RL portfolio, I am happy to hold for now.
$IKE remains my strongest conviction microcap, with results across the board this Q reinforcing this view.
Disc: Held in SM and RL
I've been following $IKE closely over recent months. Trading liquidity is an issue, but more recently those in the market looking to buy significantly outweigh the sellers. (see below)
After a recent email exchange with CEO Glenn, I'm confident that they are focused on the cost / margin aspects of the business, so in the next 12 months we should start to see how the operating economics are shaping up as the business scales.
Given the recent positive update of strong growth in transaction revenues, if the full accounts in November and outlook update confirm the increasingly positive position, and the receding spectre of the need for more capital (which Glenn has been adamant about now for the last year), we could see significant upward pressure on SP to encourage some holders to sell. I don't expect to be among the sellers, as $IKE is one of my stronger conviction speculative holdings for the longer term (covered in previous straws).
I'm just hoping that they are not added to the list of small techs that get taken private while valuations are under pressure. A couple of their competitors in the USA have been taken private over the last few years.
Disc. Held RL (2.7%) SM (10%)

https://newswire.iguana2.com/af5f4d73c1a54a33/ike.asx/3A604750/IKE_IKE_1H_FY23_Performance_Update
$IKS reported its 1HFY23 performance update, with full results to follow in late Nov. Overall, a positive result, with the company cashflow positive in the half, showing the impact of increasing subscription and transaction revenues from contracts won in prior periods.
Highlights report:
+ Positive cash flow was ~$2.2m in the Q2 FY23 period, and was ~$1.1m positive in the 1H FY23 period, evidencing the operating leverage in the business.
+ Cash and receivables as at 30 September 2022 grew to ~$29.3m, comprised of $25.5m cash and $3.8m receivables, with no debt.
+ Revenue 1H FY23 of ~$15.4m (+170% vs pcp).
+ This outturn is ~$0.4m above the top end of the range forecast.
+ Within this, recurring Subscription and reoccurring Transaction revenue was ~$13.6m (+183% vs pcp).
+ Gross margin in 1H FY23 of ~$8.2m (+128% vs pcp) representing a 1H FY23 gross margin percentage of ~53%.
Observations:
1HFY23 revenue of $15,4m compares with $16,0 for the whole of FY22,
Cash of $25.5m up on end of FY22 at $24.4
%GM of 58% contines the downward trend of the last four 1H periods: 72%, 67%, 63% and 58%. Will be looking for some commentary on future expectations for GM% in the 1H results call. Most of the impact appear to be due to declining platform revenue GM.
New closed contracts are the lowest in four Qs, albeit up significantly on PCP. Potentially a sign of $IKE managing cash burn by not chasing new logos too hard.
Key highlight is the strong growth in transaction revenue (see below). This indicates that existing customers are continuing to increase their use of the platform.

Conclusion.
In line with thesis.
Based on contract wins in FY22 and the commentary at the same time, these positive results are expected. They demonstrate the focus of the firm to establish a cash generative business.
Looking forward to the full accounts and report in November and the outlook, particularly around trends in existing customer adoption and new contract wins. Will request commentary on GM evolution.
Disc: Held in RL (3%) and SM (9%)
$IKE is continuing to grow strongly in the USA, focused on the North American utility sector. Here, it faces the multi-decade tailwinds of renewal of US infrastructure generally as well as heavy investment in the energy transition particularly the distribution grids. Furthermore, as a consequence of increasing frequency and severity of severe weather events due to climate change, monitoring and repair/renewal of infrastructure is also increasing.
Forecast 1HFY23 Revenue is $14.7-15.0m, up +160% over the pcp.
If growth continues to build in 2HFY23, then $IKE appears to be on track to beat my current forecast revenue of $30m. (So, I am sticking to my current valuation of $1.50, for now).
$IKE retains a “fortress balance sheet” with CEO and Board all too aware of the adverse macro environment and determined to guide $IKE to sustainable growth without need for further capital.
Market Positioning
Compared with other industry verticals, utility network engineering is unglamorous. The work requires highly trained professionals, with many of the work flows being manual, high volume and highly repetitive. Perfect candidates for digitalisation and automation.
$IKE's product suite have proven productivity improvements, which is very attractive to utilities who facing growing maintenance and capital investment programmes, with a major demongraphic challenge in their core engineering work forces.
And yet the space in which $IKE competes is not highly contested. On the call, CEO Glenn Milnes pointed out that in pole analysis, two of the three main competitors have recently been acquired by Bentley Systems. This points to a high level of market concentration and pricing power. Equally, in the IKE Office Pro space, Glenn said the work is otherwise highly manual, with only one near competitor in Catapult Engineering.
So, the AMG provided further insights underscoring that not only is the industry large, but that the market structure is very favourable to $IKE, who have almost a decade head start on any potential new entrant.
On market size and forecasts, the slide below shows the scale of the market $IKE is playing in. In terms of engineering costs, these would typically make up not less than 5% and not more than 15% of the market size. So $IKE is playing for a portion of a NZ$5-15bn market – the growth, while a tailwind, is less important because penetration is so low. $IKE is about making the engineers working in that market more efficient.

Costs
I asked how costs have progressed through this FY. Glenn stated that they were “favourable to plan”, and that they had “achieved growth without substantial expense growth”.
He noted that headcount was now 93-94. I observe that the annual report shows that there were 85 employees at the end of FY22, so this is indeed very modest growth given the level of revenue growth (headcount growth of little over 10%, while annual revenue growth running over 100%).
Glenn went on to explain that they will continue to grow in sales, account management and engineering, although this growth will be much slower than revenue. Supporting use of the product suite by existing customers is the biggest value driver in the short to medium term.
Importantly, Glenn highlighted that $IKE is now getting towards $0.3m revenue per employee p.a. - with productivity increasing. If we conservatively assume that headcount grows to c. 105 employees by the end of this year, if that level of productivity is achieved, then $IKE would achieve an exit run rate revenue in the order of $32m. This is probably lower than what will be achieved if growth in H2 continues beyond H1.
I conclude that in the 1HFY23 report due in November we are going to see some strong operating leverage kicking in.
Customers
Glenn refers to “logos added” when talking about customers. And the chart below is a sample of current customers. With over 350 “logos” at year end, >65 were added in the year. Some of these companies are huge. For example: market caps of Exelon (US$37bn), Duke($74bn) and Southern (74bn) are each much larger than the top Australian utilities combined.
 Clearly, clients are embracing the opportunity. Glenn cited that Entergy, one of the major utilities which one year ago was focused on dealing with hurricane impacts, has just finished training 340 of its engineers on courses at the $IKE University – an online capability $IKE invested in during COVID19 to assist with customer success when they couldn’t travel to customers. To dates “thousands of engineers” have been trained through $IKE University.
$IKE now serves 5 or the top 10 largest publicly traded utilities in North America. In each, the process of adoption of $IKE capabilities is a multi-year land and expand approach. (We’ve also seen this in another industry where $WTC adoption within a logistics firm takes 4-5 years.) So, each new customer brings years of locked in growth – hence the importance of investing in customer support and $IKE University.
In Q&A, Glenn added that the company is typically adding 5-10 new logos every month.
$IKE remains focused on North America, such that on their strategy roadmap, they are not looking beyond it for 3+ years.
Conclusion
I continue to be impressed by $IKE and in particular in Glenn’s no-nonsense, confident and low-key approach.
Still a microcap with low liquidity, $IKE is rapidly heading towards the inflection both in cashflow and profitability. The 1H FY23 report will give a good read out on how the business is scaling. However, we expect to hear an update on 1H FY23 revenue (including more detail breakdown than today) and cash position in a couple of weeks.
$IKE still sits firmly in my “speculative” portfolio, but my conviction grows as time progresses and I am continuing to gradually accumulate shares, having added a tiny sliver today at $0.70.
(I’m not at all phased by the macro and risk-off market. If anything, it is allowing me to accumulate more and more $IKE at a cheap price, as the investment gets de-risked. $IKE looks like it has favourable SaaS economics and a growth runway of more than a decade, with limited competition. Moreover, its customers are recession-proof. What's not to love!)
Note:
If you are unfamilar with $IKE, check out the Strawman meeting earlier this year.
Disc. Held in RL and SM.
ikeGPS releases its annual results today. No surprises as everything has been set out in the quarterly result updates.
Some headlines:
- Revenue $NZ16 (+71% pcp)
- Contracts signed during FY22 of $26m (+108% vs pcp)
- %GM of 62% (vs. pcp of 64%)
- FY22 EBITDA loss of 5.3m (vs. pcp -%5.5m)
- FY22 Net Loss of $7.9m (vs pcp -7.5m)
- Cash and receivables of $29.4m position broadly in line with December 2021
2H FY22 has seen the business move closer to breakeven, while revenue is still growing strongly.
Importantly, as well as new customers, existing customers are increasing their use. Transaction revenue increasing as a share of total revenue. (see image below)
Looking forward to the Strawman Meeting on this one.
Results call tomorrow at 11am.
Disc: Held in SM and IRL
