Price History
Premium Content
Premium Content
Premium Content
Straws are discrete research notes that relate to a particular aspect of the company. Grouped under #hashtags, they are ranked by votes.
A good Straw offers a clear and concise perspective on the company and its prospects.
Please visit the forums tab for general discussion.
- Recent
- Votes
16th December 2025: Bulletin Resources sells part of their Rebecca Lake Gold Project to Ramelius Resources.PDF
I commented here recently that while I expect RMS (which I hold - 5.1% - currently one of my top three largest gold producer positions) to be producing 500 Koz (thousand ounces) of gold per annum by 2030, I wasn't sure whether Rebecca-Roe would end up being part of that or not because it's so far from their Mt Magnet hub and will require it's own standalone Gold Mill.
My thoughts were that RMS might buy a similar high grade gold deposit or two closer to Mt Magnet and sell off Rebecca-Roe, and that might still occur, however the announcement today that RMS have bought 15 of BNR's Lake Rebecca tenements (a total of 509 square km) for half a mill ($500 K), and that those tenements are all alongside/adjacent to RMS's Rebecca Gold Project, suggests that RMS are instead bulking up their land holding to make the case even stronger for building a new gold mill (gold processing plant) for Rebecca and Roe (together known as RMS' Rebecca-Roe Gold Project), and that would be fine also, especially if they use GNG to design and build the mill (GNG is one of my top two holdings, currently around 12.2%).
RMS also releassed this about a fortnight ago: Rebecca-Roe Gold Project - Agreement Signed with Kakarra Part B Native Title Holders.pdf [04-Dec-2025]
Either way RMS are already in the ASX100 and they'll be a 500 Koz producer within 5 years, and that's going to get a heap more eyes on them and generate a lot more interest in the company.
It's important to remember however that there is going to be a big drop off in production in the current (FY2026) Financial Year compared to their record FY2025 production, and that's all in their guidance for this year, which is significantly lower than last year - which is a direct result of their Edna May Mill being put on C&M earlier this year because the gold that they owned around that mill had all been mined out. So currently all of their production is coming from Mt Magnet and their big growth projects there are their high-grade Dalgaranga assets (Never Never and Pepper) that came with the Spartan acquisition and those will take around 18 months to 2 years to develop and fully come online (and will be processed through their Mt Magnet Mill).
While I still have a high weighting to RMS (5.1% based on last Wednesday's prices when I last updated my spreadhseet), I do expect there's a strong chance that the RMS SP actually goes down when they report in Feb for H1 of FY26 because of the lower production this FY, even though it has been well flagged. Sometimes the market doesn't have a great memory for these things. If they get sold down significantly when they report in Feb, I am very likely to top up my RMS position.

Map Source: https://www.rameliusresources.com.au/wp-content/uploads/bsk-pdf-manager/2025/11/5-Year-Growth-Pathway-to-500koz-Investor-Presentation-November-2025.pdf [03-Nov-2025]
25th August 2025: FY25 Financial Results and Dividend (4 pages) plus Appendix 4E and FY25 Annual Financial Report (105 pages) plus FY25 Financial Results Presentation (22 pages).
The following (apart from their chart) is sourced from the documents listed above that RMS released today.


What a result !!!!!!!


This is amazing stuff - they mined 63% LESS ore than FY24 and milled 16% LESS ore than FY24 (they had stockpiled ore left from FY24 to mill), yet they produced MORE gold and reduced their costs per ounce produced. How? Because their average mined grade was up a whopping +129% to 5.7 grams/tonne of ore. What a difference grade can make!!

Outstanding!!
And this is BEFORE any contribution from the Spartan assets they've just acquired!
And they are rewarding their shareholders with outstanding TSR's derived from both dividends and share price appreciation:


The market liked it with the RMS share price finishing up +7% today.
Disclosure: Held (both here and in my SMSF).
21-Feb-2025: H1 FY2025 Results:

That's page 1 of today's results announcement: RMS-Financial-Results-for-the-Six-Months-to-31-December-2024.PDF
Also released today: H1 FY25 Financial Results Presentation.PDF
I would normally paste some of the slides from that presentation into this straw, but they're all good, so just click on the link and have a gander.

Disclosure: Holding, both here and in my SMSF.
12-Dec-2024: 8:17 am AEDT: Rebecca Roe Gold Project Prefeasibility Study
12-Dec-2024: 9:03 am AEDT: Rebecca Roe PFS presentation


So this is the PFS (preliminary feasibility study), the DFS (definitive FS) isn't due until mid-2025, and the FID on whether to proceed with the project will depend on the DFS results.
If there's a positive FID based on that DFS next year, then mining at Rebecca is expected to begin in September 2026 and mining at Roe in October 2027, so these are future growth projects for Ramelius, who have plenty of other producing assets as well as development assets for future years.

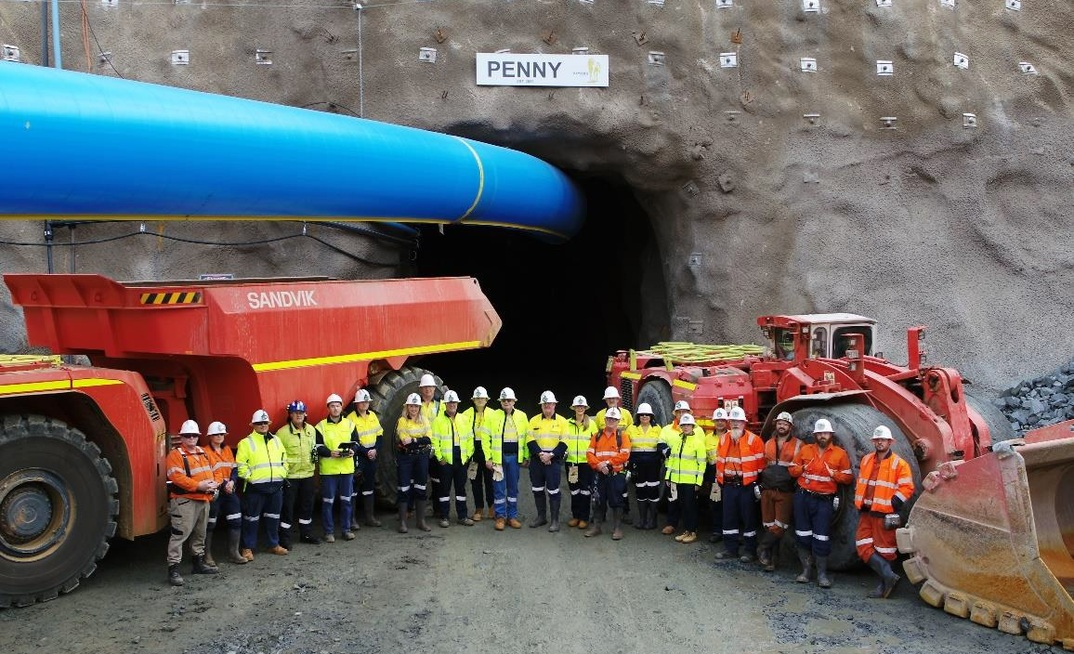
Map Source: RMS: Penny Gold Mine Update [15-Sep-2023] [When they were buying Musgrave Minerals last year]
Ramelius Resources (RMS) acquired Breaker Resources in March 2023 to consolidate its Rebecca Gold Project with Breaker's Lake Roe Gold Project. Rebecca was acquired by RMS a year earlier, in 2022 when it bought Apollo Consolidated.
Ramelius have a good track record of M&A to build up a portfolio of future growth assets. They have also been finding more gold within their existing tenements, which provides organic growth as well.
In other recent news from RMS:
12/12/2024: 5:21 pm AEDT: Change-in-substantial-holder-notice-from-RMS-for-SPR-(Spartan Resources).PDF
RMS took part in SPR's CR and RMS now own 19.9% of Spartan, up from 17.94% previously.
I have been looking to buy a little Spartan myself, but not up around $1.40 to $1.50 where they've been trading this week - when they have just raised A$220 million at A$1.32/share and prior to that were trading at $1.10/share four weeks ago - and I thought they looked expensive at $1.10 to be honest. I know the CR has derisked them somewhat, but I have noted the SPR share price has fallen for the past 5 trading days in a row, after spiking up over +10% to $1.58 when they came out of that CR trading halt last week - and I think they can fall further. For now I'm happy having exposure to SPR through RMS (who own 19.9% of SPR).
And back on the 4th:
04/12/2024: 8:16 am AEDT: Ramelius-Management-Changes.PDF
Disclosure: I hold RMS. Low cost gold miner and good allocators of capital.
16-Sep-2024: RMS released this today: September 2024 - Gold Forum Americas Presentation
[link didn't work, but hopefully I've fixed it now]
Interestingly, they went ex-div for a 5 cps fully franked dividend on Friday (13th Sept) and their share price didn't fall - it actually rose - they were up +14 cps or +6.54%, which is a fairly decent move on a day when buyers do NOT get their latest dividend. They're down today however. At this point, around 1:30pm Sydney time, RMS is -9 cps (-3.95%), yet still above where they were on Thursday evening (@ $2.14, now $2.19) before going ex-div on Friday.
I hold Ramelius Resources (RMS) - they have everything I'm looking for in an Australian gold producer right now, as I've explained in other straws and/or forum posts here. Good management who are very disciplined around M&A, good growth, zero debt, a pile of cash, increasing dividends, very profitable, and low costs - one of the lowest cost gold producers in Australia currently, and they're finding more gold around their existing tenements, close to their own mills, and good grades too.
The thing is - they've risen from a recent low of $1.82 on August 8th, to $2.28 on Friday (13th Sep) at the close, so they've put on +22% in five weeks, so they're not as cheap as they were. Still a hold here though, if not an outright buy. My best guess is they go higher from here, because they have so many positives, and the only negative would be a falling gold price, and we haven't got that at this point in time, so as long as the gold price holds up (or rises), RMS still look very good to me. I hold them in my SMSF as well as in my other larger portfolio.
Further reading: https://www.rameliusresources.com.au/presentations/

https://www.rameliusresources.com.au/company-overview/

30-Aug-2024: I was going to title this straw "Hedging", but it's really a bull case for Ramelius (RMS), so I've changed the title to "Bull Case". Let's start with their RMS' hedgebook as at June 30th now that they've reported - and their hedge book is now down to 155 Koz, as we can see on slide 10 from their FY24 Financial Year Results Presentation [released on Monday, 26th August]:
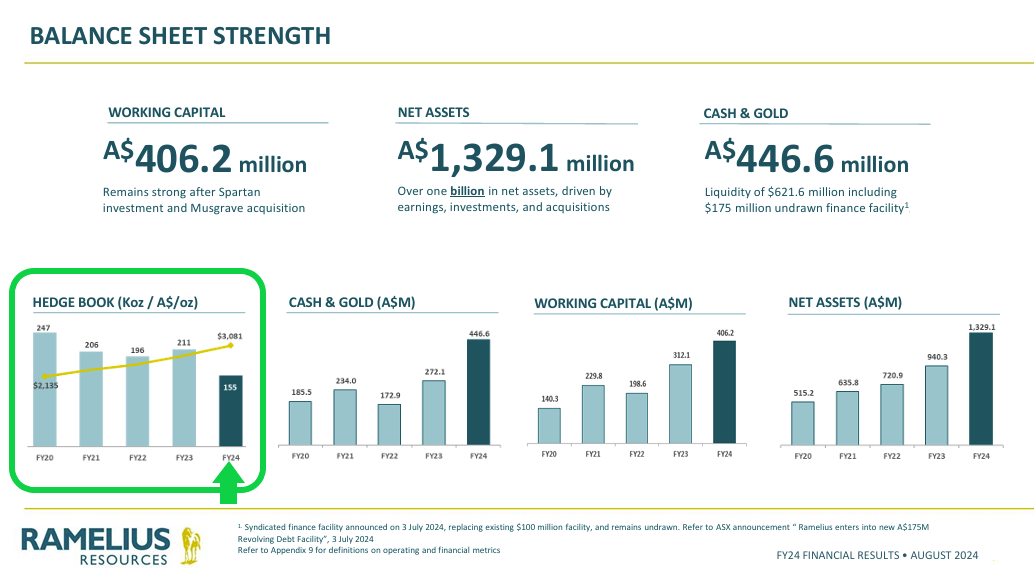
It was 211 Koz at June 30, 2023, then 19 Koz less at 192 Koz at Dec 31, 2023, and then 37 Koz lower at 155 Koz at June 30, so those hedges are reducing.
The yellow line is their average contracted gold price for their remaining hedges, which keeps rising, as I note below. It stood at $3,081/oz at 30-June-2024.
Below is from page 92 of their FY24 Annual Financial Report:
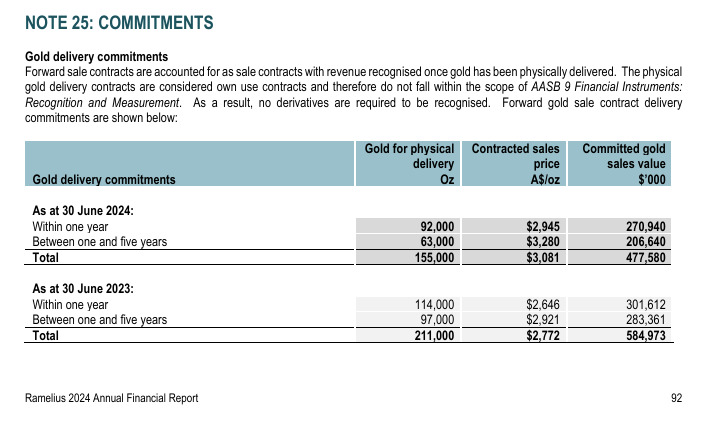
I think they will continue to increase the rate at which they close out those hedges and reduce their hedgebook. They also appear to be selling into their lowest priced hedges, because the remaining average contracted price (A$/oz) is increasing from $2,772 at 30-June-2023 to $2,918 at 31-Dec-2023 to $3,081 at 30-June-2024.
And it doesn't seem to be negatively affecting their numbers. Here are the FY24 highlights:
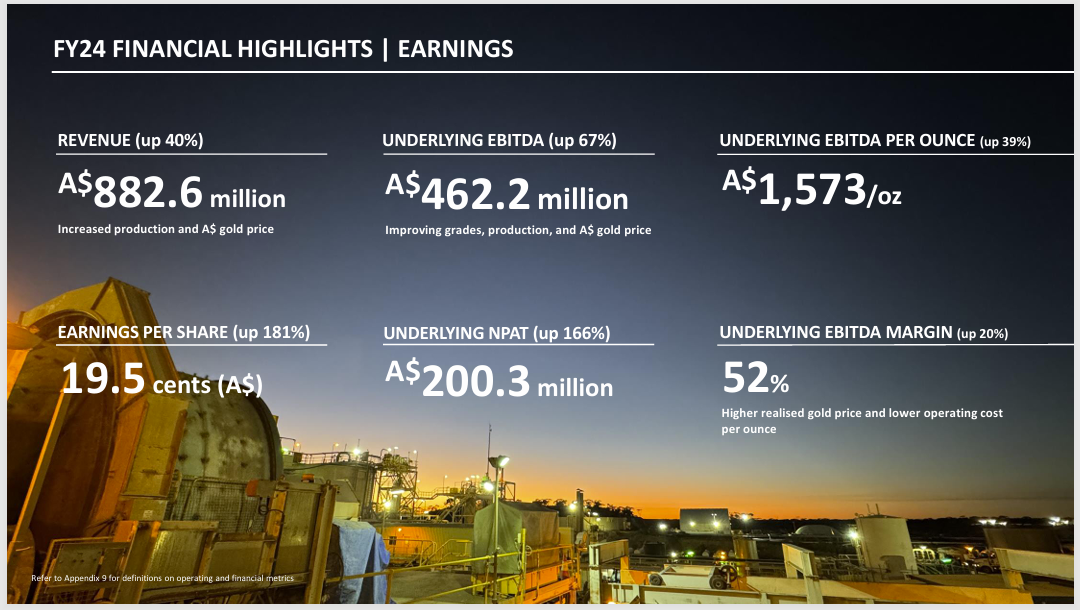

This is possible through a relatively small hedgebook at relatively high prices, meaning they are more exposed to the higher spot price, as well as having some of the lowest costs across the Australian gold industry. Ramelius are certainly in the lowest quartile of the cost curve. There are not too many Aussie gold producers with lower costs unless you start using copper production for byproduct credits (like Evolution Mining does with two of their mines producing far more copper than gold).
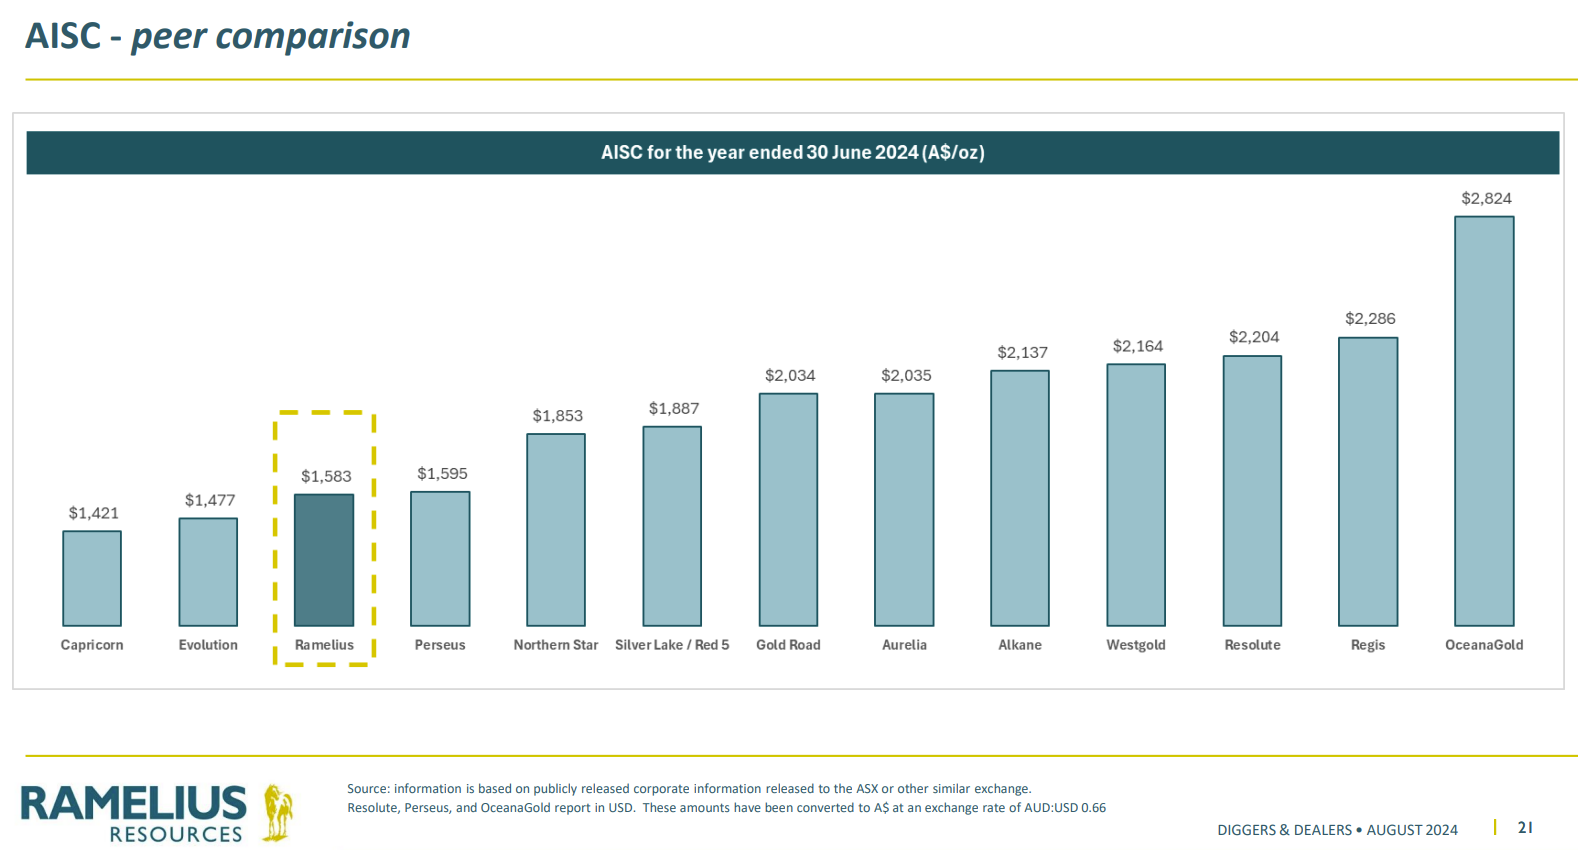
Here's Ramelius' FY24 cost Breakdown:
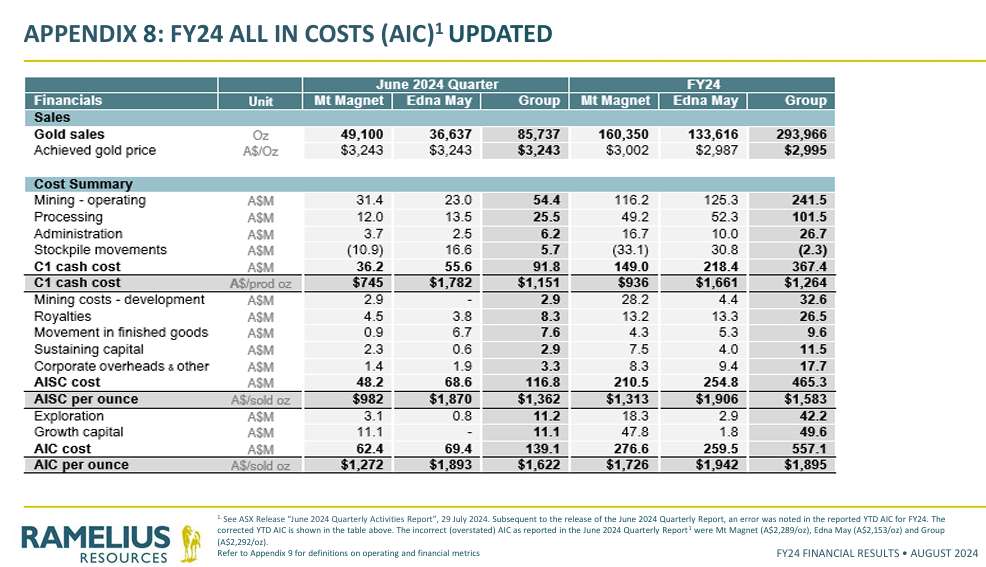
FY24 Group AISC of A$1,583/oz, and Group AIC of A$1,895/oz, when many of their peers are well over $2,000/oz for their AISC and don't even disclose their AIC like RMS do.
You can also see there (above) that their June 2024 Quarter Results were lower than that, at A$1,362 (AISC) and A$1,622, so they're trending DOWN, not up.
Here's their guidance for the current year (FY25) that will end on June 30 next year:
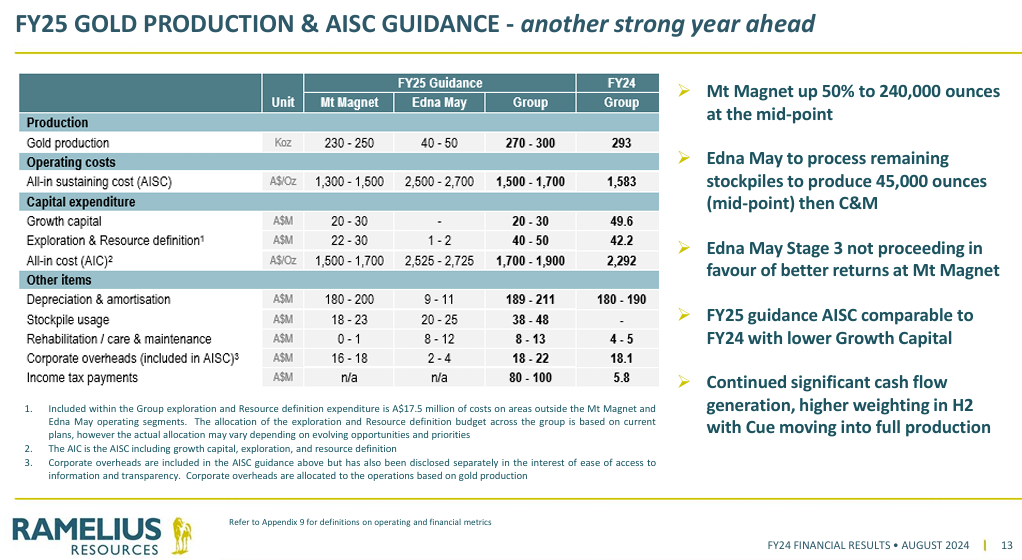
Conservative FY25 production and cost guidance range of 270 to 300 Koz gold at $1,500 to $1,700 AISC (mid-points of 285 Koz @ $1,600/oz), much the same as FY24 (293 Koz @ $1,583/oz) and given that based on recent history they will probably hit the top end of that production guidance or exceed it, and be within the lower half of their cost guidance, I would say that FY25 is going to be AT LEAST as good as FY24. In fact, it SHOULD be better, because their Capex is going to be lower so their AIC is going to be lower in FY25 than in FY24.
They've got an FY24 AIC of $2,292/oz there in the table above which is $397 higher than the $1,895 FY24 AIC they've got on slide 24 of the same presentation (two tables up here) - and I can explain that difference. First, both of those slides are from the same slide deck, being their 25 page FY24 Financial Results Presentation (pages 13 and 24), however slide 24 - which is Appendix 8 (two tables up from here in this straw) - has an explanation at the bottom saying: See ASX Release “June 2024 Quarterly Activities Report”, 29 July 2024. Subsequent to the release of the June 2024 Quarterly Report, an error was noted in the reported YTD AIC for FY24. The corrected YTD AIC is shown in the table above. The incorrect (overstated) AIC as reported in the June 2024 Quarterly Report were Mt Magnet (A$2,289/oz), Edna May (A$2,153/oz) and Group (A$2,292/oz).
On that slide, the corrected numbers were Mt Magnet (A$1,726/oz), Edna May (A$1,942/oz) and Group (A$1,895/oz). However, back on slide 13 (the first table above) they have used that old (incorrect) $2,292 Group AIC number. That is wrong - it should be $1,895, same as on slide 24 (second table up from here).
If you want to view the incorrect numbers on their June quarterly report, you can view that report here: June 2024 Quarterly and FY25 Guidance presentation - the slide they're talking about is slide 12 of that presentation. They may not have considered it material (in terms of putting out a correction sooner) because they were overstating their costs not understating them, but it is important to get that number correct, otherwise it would have looked like a substantial drop in AIC between FY24 and FY25, when it fact it's going to be fairly similar AIC (All-In Costs), just likely a little lower in FY25 based on their guidance mid-point. So with that in mind, it's not good that they put the wrong number in the table on slide 13 (again) a full month later, having noted the correction further down in the same report (on slide 24).
In summary their correct FY24 AIC is A$1,895, and they're guiding for an AIC of between A$1,700 and $1,900, so the FY25 guidance mid-point is AIC of $1,800/oz, vs $1,895/oz (actual) for FY24, so lower overall costs this year hopefully. And the gold price might just keep rising too!
These last two slides (below) sum up where I see the value in RMS right now. Firstly rising dividends to add to the TSRs, which are supported by rising earnings, and then the stuff on the final slide - which is all about management execution in terms of strategic planning and sensible capital allocation decisions, as well as a series of near-term positive catalysts that should keep driving the share price higher if things go to plan.
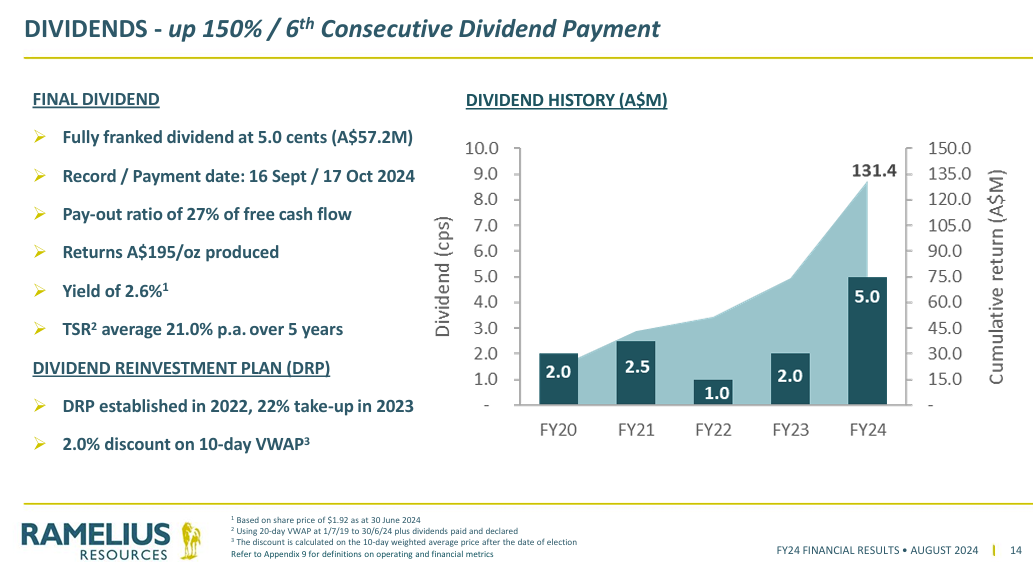
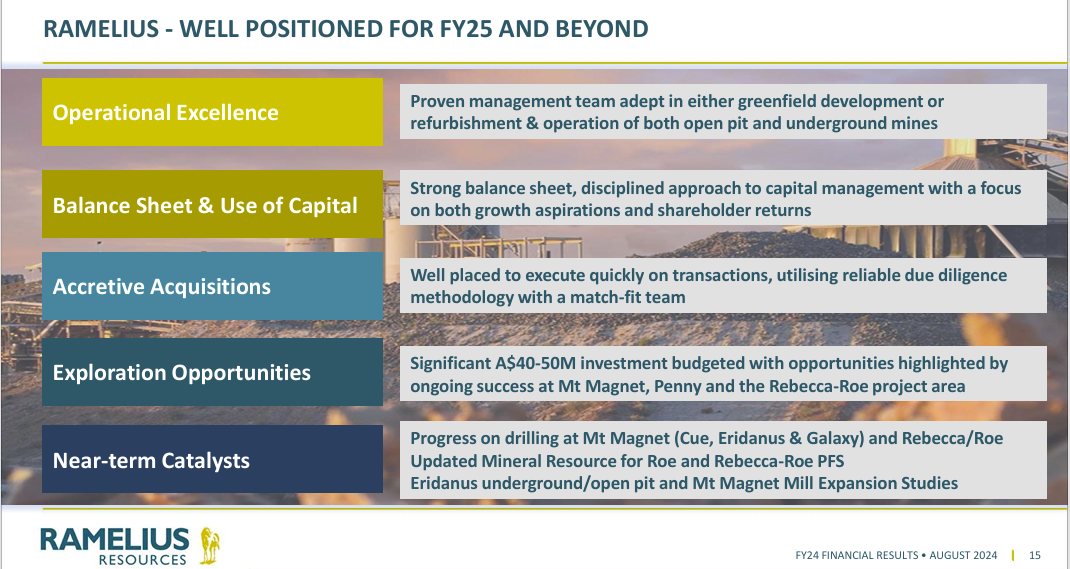
So, hopefully you can see why I'm happy to be holding RMS at this point. They made a new 12-month high today also, which also happens to be their new all-time high. They closed at $2.22 today and they tagged $2.23 during the day. They've never been this high before. And it's pretty obvious to me that they are in better shape than they've ever been before, so it makes perfect sense for them to be making new all-time highs.
26-August-2024: RMS-FY24-Financial-Results-and-Dividend.PDF

That's the first page (link above).
Also: 2024-08-26 Financial Report and Appendix A4 for the Year Ended 30 June 2024
And: FY24 Financial Results Presentation
And: August 2024 - Diggers and Dealers presentation
Disclosure: I hold RMS shares.
07-March-2024: Ramelius in 'trading halt' to respond to takeover speculation (miningnews.net)
RMS ASX: Ramelius Resources in exclusive due diligence to acquire Karora Resources (afr.com) [Sarah Thompson, Kanika Sood and Emma Rapaport, Mar 7, 2024 – 12.26pm]
Street Talk
Ramelius in exclusive due diligence to buy Karora
Ramelius Resources is in exclusive due diligence to acquire Toronto-listed WA gold miner Karora Resources, which it hopes will add a new production centre to replace its ageing Edna May asset.
Street Talk can reveal Ramelius boss Mark Zeptner will spend $700 million to $1 billion for the acquisition. Karora will bring new production hubs with mills, and could help the company consolidate its position in the region. A Ramelius spokesperson declined to comment.
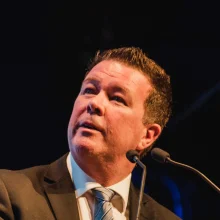
Ramelius Resources chief executive Mark Zeptner. Billy-Ray Stokes
Karora’s portfolio, located 60 kilometres from Kalgoorlie, includes 100 per cent ownership of the Beta Hunt mine, Higginsville gold operations and Spargos gold mine. It is expected to produce 170,000 to 195,000 ounces gold in 2024. By contrast, Ramelius has told shareholders it would hit 272,500 ounces production this financial year.
Zeptner and his team are chasing the acquisition after a period of solid performance and perky gold prices. Ramelius shares have risen nearly 48% in the past year, giving it a $1.8 billion market capitalisation and a strong balance sheet.
In particular, it has benefited from high-grade Penny ore being fed into the Mt Magnet Mill. Cash and gold reserves are expected to hit $400 million by year-end, while about $100 million in undrawn debt would further boost its liquidity profile.
Ramelius reported a 14% increase in revenue to $348.5 million at its half-year results on February 20. EBITDA shot up 39% to $140.2 million, thanks to a 12% jump in realised gold price.
New production centre
Ramelius’ biggest asset is the Mt Magnet production centre, which it started building via a $40 million acquisition in 2010. Now, 14 years on, Mt Magnet speaks for 62% of the group’s gold reserves. When combined with Vivien and Penny, it is 53% of the total net present value, according to Macquarie Capital analysts. Production is expected to reduce significantly by the 2029 financial year.
But the more pressing matter for Zeptner has been finding a replacement for Edna May, which it bought from Evolution Mining in 2017. It is now just 2% of the reserves, with a significant production slump ahead in the 2025 financial year. Other bets like the Rebecca project are still a long way from spitting out cash.
Put that all together, and it’s not surprising the management has been on the prowl for acquisitions. Sources told this column logical targets had included Spartan Resources as well as Northern Star’s Carosue Dam. However, the former isn’t operational, while the latter would have been hard to prise from its current owner.
The mooted acquisition at Karora comes after Ramelius acquired ASX-listed gold junior Musgrave Minerals in September.
--- end of excerpt --- [small edits by me]
Disc: I hold RMS and NST shares in real money portfolios, and NST here on SM.
RMS is in a trading halt tonight pending a response to this media speculation in the AFR, which sounds like it's on the money.
01-July-2020: RAMELIUS EXTENDS LIFE OF MINE PLAN BY 34% TO 1.45Moz & JUNE 2020 QUARTER RECORD PRODUCTION
JUNE 2020 QUARTER RECORD PRODUCTION of 86,517 ozs
HIGHLIGHTS
- Quarterly gold production of 86,517oz (Guidance >80,000 oz)
- FY2020 gold production of 230,426 oz (Guidance 225 – 230,000oz)
- Cash and gold balance of A$185.5M (Net cash of A$161.1M)
- Takeover Offer for Spectrum Metals has completed, with Ramelius now 100% owner of the Penny Gold Project
Ramelius Resources Limited (ASX: RMS) is pleased to advise that it has achieved the recently upgraded June 2020 Quarter Production Guidance with a record 86,517 ounces of gold produced. For the full FY2020 year, record production was also achieved with 230,426 ounces produced. Further, the Company’s balance sheet remains strong with cash and gold of A$185.5M and a reduced debt figure of A$24.4M as at the end of the Quarter, giving a net cash position of A$161.1M. A provisional update on operational, corporate, finance and the Company’s response to COVID-19 follows.
OPERATIONS
Group Quarterly gold production of 86,517 ounces (Guidance: >80,000 ounces): • Mt Magnet (incl. Vivien) – 61,161 ounces • Edna May (incl. Marda) – 25,356 ounces
CORPORATE DEVELOPMENT
On 23 June 2020, Ramelius achieved the acquisition of 100% of Spectrum Metals Ltd (ASX: SPX) (“SPX”), pursuant to its off market takeover offer announced on the ASX on 10 February 2020 (“Offer”).
FINANCE & FORWARD GOLD SALES
Cash and gold on hand was A$185.5M at the end of the Quarter (Mar 2020 Qtr.: A$125.4M) after planned capital and exploration expenditure, funding the final A$9.1M cash component of the SPX acquisition, a scheduled A$8.1M debt repayment and payment of A$1.2M in a provisional income tax instalment. Underlying cash and gold, which excludes the debt repayment, SPX related costs and income tax, increased by A$78.5M over the Quarter. The Company finished the Quarter with a net cash position of A$161.1M. Ramelius continues to deliver gold into its forward sales book as the current schedule requires, with an end of year position of 247,350 ounces at an average price of A$2,135/oz.
COVID-19
Ramelius has, like many of its peers, begun to relax some of the processes previously implemented at the start of the pandemic, mainly related to physical distancing. The Company continues to carry out pre-commute and pre-return to work screening processes.
Further details will be available in the full Quarterly Report later this month.
--- ends ---
They're travelling well, and with the US$ gold futures price going over US$1,800/oz briefly overnight (a 7-year high) and the A$ gold price having hit an ALL-TIME record high of A$2,748/oz in March and then almost reaching that level again on May 15th (less than 7 weeks ago, got to A$2,724) and sitting at around A$2,588/oz as I type this, it's a very good time to be hitting your straps as an Australian gold miner with all of your gold mines located here in Australia.
While I don't currently hold RMS shares, I view them as one of the better mid-tier Australian gold producers. They have excellent management and they work their assets hard.
05-Oct-2020: Update: I found this today saved as a "private" straw, so made it public, but forgot to mention I do now hold RMS in my SMSF. I bought them a couple of months ago, and they've had a decent run up until September 18th - when they closed at $2.47/share. They've dropped -17% in the past couple of weeks however, and they closed at $2.05 today. They're one of Australia's top 10 pure-play Australian-based gold producers, and I'm happy to be holding them. My brother recently did a shutdown at RMS's Mt Magnet gold mine (in WA) and reported that they seem to be well run, with a good culture, and a good site. He couldn't find any negatives, and he usually can, so I'm taking that as positive feedback. Everything other than this last paragraph was written back on July 1st (2020).
01-Oct-2020: September 2020 Quarter Production Update
SEPTEMBER 2020 QUARTER GUIDANCE EXCEEDED WITH PRODUCTION OF 71,344 OUNCES
HIGHLIGHTS
- Quarterly gold production of 71,344oz (Guidance: 65 - 70,000oz)
- Cash and gold balance of A$221.9M (Net cash of A$205.7M)
Ramelius Resources Limited (ASX: RMS) is pleased to advise that it has exceeded the September 2020 Quarter Production Guidance with 71,344 ounces of gold produced. The Company’s balance sheet remains strong with cash and gold of A$221.9M and a reduced debt figure of A$16.25M as at the end of the Quarter, giving a net cash position of A$205.7M. A provisional update on operational, finance and the Company’s ongoing response to COVID-19 follows.
OPERATIONS
Group Quarterly gold production of 71,344 ounces (Guidance: 65 - 70,000 oz):
- Mt Magnet (incl. Vivien) – 41,064 ounces
- Edna May (incl. Marda) – 30,280 ounces
FINANCE & FORWARD GOLD SALES
Cash and gold on hand was A$221.9M at the end of the Quarter (Jun 2020 Qtr: A$185.5M) after planned capital and exploration expenditure, a scheduled A$8.1M debt repayment, stamp duty payment on the 2019 Explaurum acquisition of A$3.6M and a A$1.1M income tax instalment. Underlying cash and gold, which excludes the debt repayment, increased by A$44.6M over the Quarter. The Company finished the Quarter with a net cash position of A$205.7M.
Ramelius continues to deliver gold into its forward sales book as the current schedule requires, with a Quarter end position of 238,750 ounces at an average price of A$2,223/oz.
COVID-19
Ramelius continues to maintain certain procedures, related to physical distancing and pre-commute screening. The Company continues to carry out swab testing and/or wearing of clinical masks on aircraft where required, as well as carry out temperature testing and screening processes prior to commuting to sites.
Further details will be available in the full Quarterly Report later this month.
[I hold RMS shares in my SMSF.]
28-Sep-2020: Resources and Reserves Statement 2020
Ore Reserves up 32%
Ramelius Resources Limited (ASX: RMS) is pleased to announce new estimates of Mineral Resources and Ore Reserves as at 30 June 2020, with Mineral Resources up 15% and Ore Reserves up 32% for the year, after mining depletion.
Total Mineral Resources are estimated to be;
- 90 Mt at 1.6 g/t Au for 4.7 Moz of gold
Total Ore Reserves are estimated to be;
- 17 Mt at 2.1 g/t Au for 1.1 Moz of gold
Increases were achieved at Ramelius’ gold projects in Western Australia via drilling and resource additions at Eridanus, Shannon and Vivien, plus the acquisition of the Penny project. As in previous years, the Company’s ability to consistently meet production guidance has been underpinned by realistic resource modelling and deliverable reserve estimates. Growth in both Mineral Resources and Ore Reserves has accelerated in recent years as illustrated below.
[I can not replicate that chart referred to above - at the end of that last paragraph - but you'll see it if you click on the link above. I hold RMS shares in my SMSF.]
24-Aug-2020: FY20 Financial Results and Dividend and FY20 Financial Results Presentation plus Appendix 4E and FY20 Annual Financial Report
RAMELIUS DELIVERS 420% INCREASE IN NET PROFIT AFTER TAX AND DECLARES 2.0cps DIVIDEND
FY2020 HIGHLIGHTS
- Gold production of 230,426 ounces (FY19: 196,679oz), up 17%
- AISC* of A$1,164/oz (FY19: A$1,192/oz), down 2.4%
- Revenue from ordinary activities of A$460.6M (FY19: A$352.8M), up 31%
- EBITDA** of A$256.0M (FY19: A$112.2M), up 128%
- EBITDA** margin of 56% - one of the highest amongst peers
- Net profit before tax (NPBT) of A$149.5M (FY19: A$30.4M), up 392%
- Net profit after tax (NPAT) of A$113.4M (FY19: A$21.8M), up 420%
- Cash and bullion of A$185.5M (FY19: A$106.8M), with A$24.4M debt
- Net Cash of A$161,1M
- FY2021 Guidance 260,000–280,000oz at an AISC of A$1,230–$1,330/oz^ [one of the lowest cost gold producers in Australia]
- Dividend of 2.0 cents per share fully franked
Ramelius Managing Director, Mark Zeptner, today said:
“This is the sixth consecutive year that Ramelius has posted a net profit after tax, which demonstrates the operating and financial strength of the Company, its quality assets and the success of our growth strategy. It is very pleasing to also announce a 2.0c per share fully franked dividend after our record breaking year, building on the 1.0c per share dividend paid in October 2019.
Ramelius is proud of the fact that it is now rewarding shareholders with a dividend yield, in addition to the significant share price growth achieved over the last 12 months.”
--- click on links above for more --- [I hold RMS shares - in my SMSF.]
Notes:
*All-in Sustaining Cost (AISC) includes cash costs, plus royalty expenses, sustaining capital, general corporate and administration expenses on a per ounce sold basis.
** EBITDA is earnings before interest, tax, depreciation, and amortisation and is calculated from continuing operations. EBITDA is a financial measure which is not prescribed by the International Financial Reporting Standards (IFRS) and represents the profit under IFRS adjusted for specific significant items. EBITDA has not been subject to any specific review procedures by the auditor but has been extracted from the company’s financial statements.
^ Refer ASX Announcement “Ramelius Extends Life of Mine by 34% to 1.45Moz” released on 30 June 2020.
27-7-2020: June 2020 Quarterly Activities Report and Guidance
HIGHLIGHTS
- Record quarterly group gold production of 86,517 ounces at an AISC of A$1,041/oz (Original Guidance 65,000 – 70,000 ounces at an AISC of A$1,000 – A$1,100/oz):
- Mt Magnet (incl. Vivien) – 61,161 ounces at an AISC of A$867/oz
- Edna May (incl. Marda) – 25,356 ounces at an AISC of A$1,488/oz
- Record full year production for FY2020 of 230,426 ounces at an AISC of A$1,164/oz
- Cash & gold of A$185.5M (Mar 2020 Qtr: A$125.4M) after A$14.4M capital expenditure and A$10.4M on the Spectrum Metals Limited (“Spectrum”) takeover
- Net cash & gold increased A$68.2M across the Quarter
- Takeover of Spectrum completed on 23 June 2020
- Publication of 1.45Moz Mine Plan, primarily across six years to FY2026
PRODUCTION GUIDANCE – FY2021
- Group gold production for FY2021 is expected to be a new record of between 260,000 – 280,000 ounces at an AISC of A$1,230 – A$1,330/oz. Production is expected to be sourced as follows:
- Mt Magnet (incl. Vivien) – 155,000 ounces
- Edna May (incl. Marda) – 115,000 ounces
PRODUCTION GUIDANCE – SEPTEMBER 2020 QUARTER
- Group gold production for the September 2020 Quarter is expected to be between 65,000 – 70,000 ounces at an AISC of A$1,250 – A$1,350/oz:
- Mt Magnet (incl. Vivien) – 43,000 ounces
- Edna May (incl. Marda) – 24,500 ounces
- Capital & project development expenditure of approximately A$25.9M, including:
- Eridanus & Brown Hill open pits (Mt Magnet) - A$14.9M
- Marda open pit roadworks - A$1.3M
- Tampia open pit pre-development - A$2.9M
- Exploration (all projects) - A$6.8M
CORPORATE
- Quarterly gold sales of 89,345 ounces for total revenue of A$198.6M from an average gold price of A$2,223/oz
- Cash & gold on hand of A$185.5M (Mar 2020 Qtr: A$125.4M). This is after repayment of $8.1M in debt and further investment into the development of Ramelius’ portfolio, including A$6.9M on exploration, A$7.5M in project development costs, and $10.4M on the acquisition of Spectrum.
- Cash & gold on hand, net of debt, was A$161.1M (Mar 2020 Qtr: A$92.9M), representing an increase of A$68.2M.
- As at the end of June 2020, forward gold sales consisted of 247,350 ounces of gold at an average price of A$2,135/oz, covering the period to December 2022.
--- click on link above for the full report ---
While I don't currently hold any RMS shares, I consider Ramelius to be an excellently managed gold producer, one of our top 10 ASX-listed producers now, with a great net cash position (over $160m net cash/gold) with some sensible hedging at an average price of A$2,135/ounce through to December 2022. While Edna May has higher costs, their AISC for Mt Magnet (including Vivien) was only A$867/oz in the June 2020 quarter, and Mt Magnet has produced - and will continue to produce - more gold than Edna May, so RMS's group AISC (across both mining centres) will remain competitive - with current guidance of AISC between A$1,230 and A$1,330/oz in FY2021.
I think they've once again given themselves scope to beat their own guidance in FY21 (as they have just done in FY20) and I think RMS are going to continue to get positively rerated by the market as they continue to perform well in a very supportive gold-price environment.
23-June-2020: Hartleys: RAMELIUS RESOURCES LTD (RMS): Lights out quarter
Hartleys have a BUY call on RMS, a $1.85 valuation, and a $2.40 12-month price target.
Other Broker Coverage of Ramelius Resources can be reached here: https://www.rameliusresources.com.au/broker-coverage/
22-June-2020: Ramelius on track for record quarter FY2020 Guidance upgrade
RAMELIUS ON TRACK FOR RECORD QUARTER OF OVER 80,000oz GOLD PRODUCED, FY2020 GUIDANCE UPGRADED
HIGHLIGHTS
- June 2020 Quarter production already a new record of 74,371oz (as at today’s date)
- Full June 2020 Quarter production now expected to exceed 80,000 ounces (Previous Guidance was 65 - 70,000oz)
- Full FY2020 production Guidance upgraded to record 225 – 230,000 ounces (Previous Guidance 210 – 220,000oz)
Ramelius Resources Limited (ASX: RMS) is pleased to advise that it has exceeded the Production Guidance range for the June 2020 Quarter, with 74,371 ounces of gold produced as of 21 June 2020.
This already represents record quarterly and annual production for the Company with two weekly gold pours remaining and has been achieved as a result of excellent performance from both West Australian production centres, particularly Mt Magnet. Based on the production figures received to date, Ramelius has upgraded Guidance for both the June 2020 Quarter and FY2020 as highlighted above.
Ramelius Managing Director, Mark Zeptner today said:
“We are obviously delighted by the operational performance in achieving records in both quarterly and annual gold production, particularly against the backdrop of COVID-19 and the additional administrative requirements the pandemic has necessitated.
We remain confident that Ramelius, with its high-performing team, excellent cash generation and enviable balance sheet, is very well positioned for the next stage of growth.”
Further details will be available in the Production Update and full Quarterly Activities Report, both due in July 2020.
--- ends ---
Gotta love upgrades! The RMS share price was up +16.76% today on the back of this one. They now have a market cap of AU$1.44 billion, and are firmly within our top 10 pure-play gold producers that are based here in Australia with their primary listing on the ASX.
The goldnerds.com.au spreadsheet lists the top 15 like this:
- NCM, Newcrest Mining
- AGG, AngloGold Ashanti *
- KLA, Kirkland Lake Gold *
- NST, Northern Star Resources
- EVN, Evolution Mining
- SAR, Saracen Mineral Holdings
- RRL, Regis Resources
- AQG, Alacer Gold *
- SBM, St Barbara
- OGC, OceanaGold
- SLR, Silver Lake Resources
- RMS, Ramelius Resources
- GOR, Gold Road Resources
- PRU, Perseus Mining
- RSG, Resolute Mining
After RSG, which has a market cap of $1.23 billion, there's a big step down to #16, which is WGX (Westgold Resources) with a market cap of only $853 million.
* However, #2, #3 and #8 (AGG, KLA & AQG) are secondary listings here by companies that are based in South Africa, Canada and the USA respectively. If you filter those three out, you are left with the following top 12:
- NCM, Newcrest Mining
- NST, Northern Star Resources
- EVN, Evolution Mining
- SAR, Saracen Mineral Holdings
- RRL, Regis Resources
- SBM, St Barbara
- OGC, OceanaGold
- SLR, Silver Lake Resources
- RMS, Ramelius Resources
- GOR, Gold Road Resources
- PRU, Perseus Mining
- RSG, Resolute Mining
RMS is now only 3.2% behind SLR's market cap, ($1.706b vs $1.760b), so RMS could easily overtake SLR if they have another day even half as good as today was.
GoldNerds works out the market cap a little differently - as explained below:
Market Capitalization = The value the stock market is currently putting on the entire company.
The market capitalization ("market cap") of a company is all of the following:
- The value of the company as determined by its recent share price and share structure.
- How much it would cost you to buy the entire company, at the recent share price.
- The value of all the company's assets, both financial and physical, including liabilities as negative assets.
To buy a company entirely, you must buy all of the:
- Fully-paid shares (both quoted and unquoted on the stock exchange);
- Shares that could be issued to holders of in-the-money options and warrants; and
- Shares that could be issued to holders of in-the-money partly-paid shares.
Out-of-the-money options and warrants and out-of-the-money partly-paid shares are worthless if someone were to buy all of a company at the current share price, because their holders would pay more than the recent share price to convert them into a fully-paid share.
The market cap is therefore calculated as the sum of:
- The number of fully-paid shares multiplied by the recent share price;
- The number of in-the-money options and warrants multiplied by the differences between their strike price and the recent share price (for each series of options or warrants); and
- The number of in-the-money partly-paid shares multiplied by the amount owing on each partly paid share (for each series of partly-paid shares).
Which is equal to the current share price multiplied by the combined number of shares and in-the-money options, warrants, and partly-paid shares, less the cost of exercising the in-the-money options and partly paid shares (the option cost).
Market cap is of interest in our analysis only because it usually roughly equal to the enterprise value (EV) of the company (because the financial net assets of a company are usually small compared to the physical assets of the company). The EV is the value the stock market is currently putting on the physical (non-financial) assets of the company.
Those same 12 gold producers in order of Enterprise Value (EV) is similar, except RMS moves up one position (leapfrogs SLR) and RSG also moves ahead of PRU:
- NCM, Newcrest Mining
- NST, Northern Star Resources
- EVN, Evolution Mining
- SAR, Saracen Mineral Holdings
- RRL, Regis Resources
- SBM, St Barbara
- OGC, OceanaGold
- RMS, Ramelius Resources
- SLR, Silver Lake Resources
- GOR, Gold Road Resources
- RSG, Resolute Mining
- PRU, Perseus Mining
Of these 12, I currently hold NST, EVN, SAR, RRL and SBM. From outside of those lists, I also hold PNR (Pantoro) which comes in at #19 on the EV list, and at #16 on the Market Cap list. The Producers list - with minimum 70% gold production - vs all other metals, and all companies headquartered here in Australia, so not including AGG, KLA or AQG - runs to 25 companies according to GoldNerds. The lower 13 - in EV order (biggest to smallest, continuing from PRU above) - are WGX, RED, DCN, PNR, TBR, BLK, BCN, MML, TRY, RND, WWI, AUL & KRM.
I also hold a couple of Developers and Explorers, being BGL and YRL - who are both still considered explorers because neither has reached FID - Final Investment Decision - to develop their respective projects into operating mines.
On top of the 25 Gold Producers, there are another 41 Gold Project Developers at various stages of project development, and another 99 Gold Explorers for a total of 165 companies. And that's using those filters - they must be 70% or more in gold, and headquartered in Australia with their primary stock exchange listing here. Remove those filters and the 165 becomes 222 companies.
As of tonight, there are a grand total of 2,127 companies listed on the ASX - you can view the complete list here - and 10.4% of those companies (222) are either gold miners, gold project developers or companies exploring for gold. That's quite a large proportion of the market when you think about it. Of course, many of those companies are very, very small, and most of them will go broke before they find something worth mining - or they'll change into a different type of company with a different focus, like a small biotech or fintech with another wonderful story. Remember the dot com bubble? So many of those new start-ups were ex-precious-or-base-metals-explorers.
Anyway, the point is, you can afford to be choosy. There are many gold companies to choose from, so choose wisely.
RMS looks like one of the better ones. I've held them before and I like their management. I will probably hold them again.
03-Apr-2020: Hartleys: RAMELIUS RESOURCES LTD (RMS): Mine plan preview
Hartleys has a "Buy" on RMS with a $1.22 valuation and a $1.40 PT (price target).
For RMS coverage by other brokers, including RBC Capital Markets, Morgans & Taylor Collison, see here: https://www.rameliusresources.com.au/broker-reports/
19-Aug-2019: https://www.taylorcollison.com.au/wp-content/uploads/2019/08/RMS-August-2019-Final.pdf
TC's PT for RMS is $1.31. RMS closed yesterday at $1.135 (and $1.16 the day before). There is a handy peer comparison chart at the top of the 3rd page, which compares RMS with SLR, RSG, SBM, RRL, SAR, NST & EVN in terms of FY20 Production Guidance, AISC (A$/oz), Net Cash/Gold and Maket Cap. RMS' AISC ("All-In Sustaining Costs") is in the more expensive half of those 8, and they are forecast to produce the least amount of gold of the 8, but they do have the lowest market cap, and they also have more cash (A$106.8m of cash/gold vs their A$838.8m market cap) than both RSG and EVN.
I don't see Ramelius as a screaming BUY myself, but they do look like better value than some of their higher quality peers. You are certainly paying up for companies like EVN, NST & SAR at current levels.
Of those 8, I currently hold NST, EVN and SBM. I have held RMS in the past, and may do so again in the future.
Post a valuation or endorse another member's valuation.


