Top member reports


Straws
Sort by:
Recent
Content is delayed by one month. Upgrade your membership to unlock all content. Click for membership options.
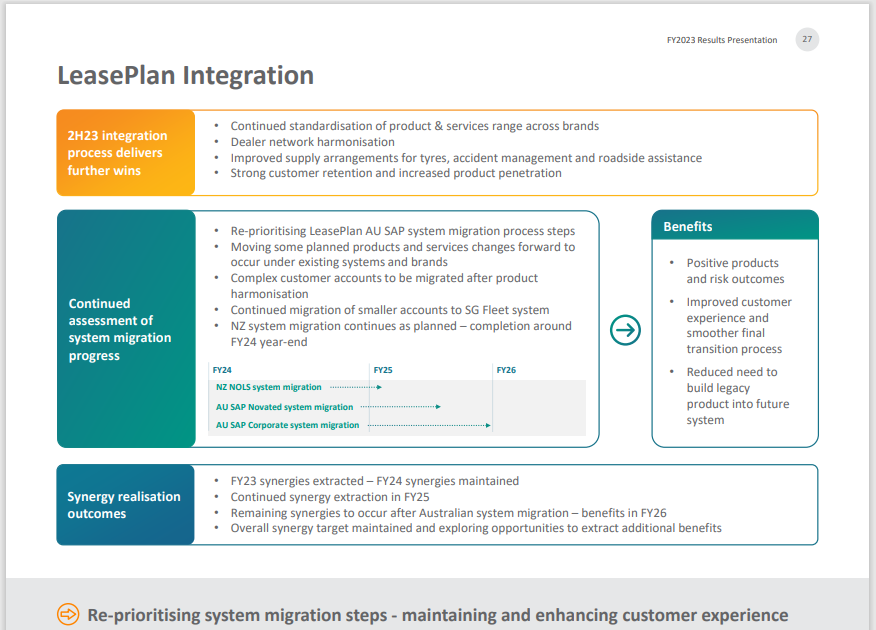
#FY23 Results Presentation
stale
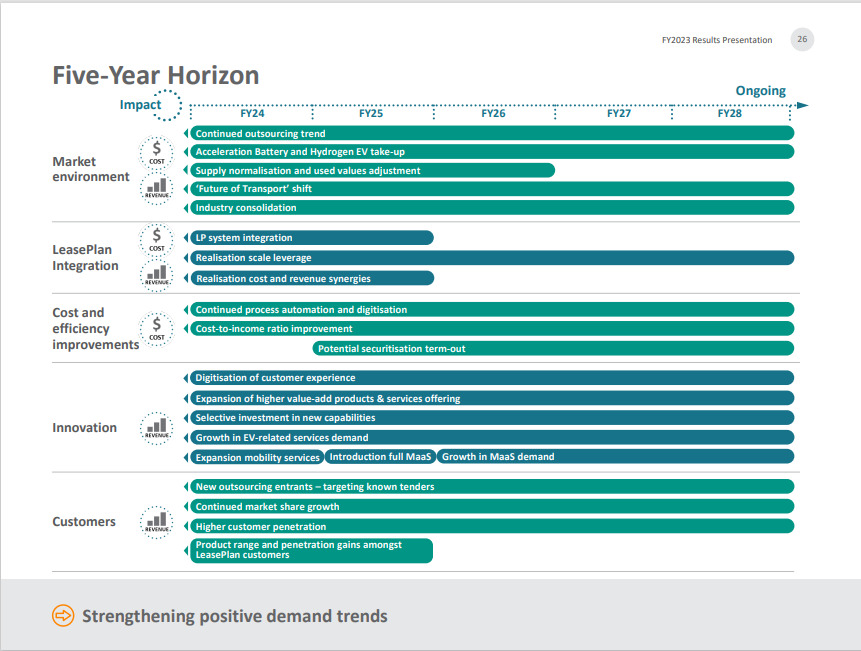
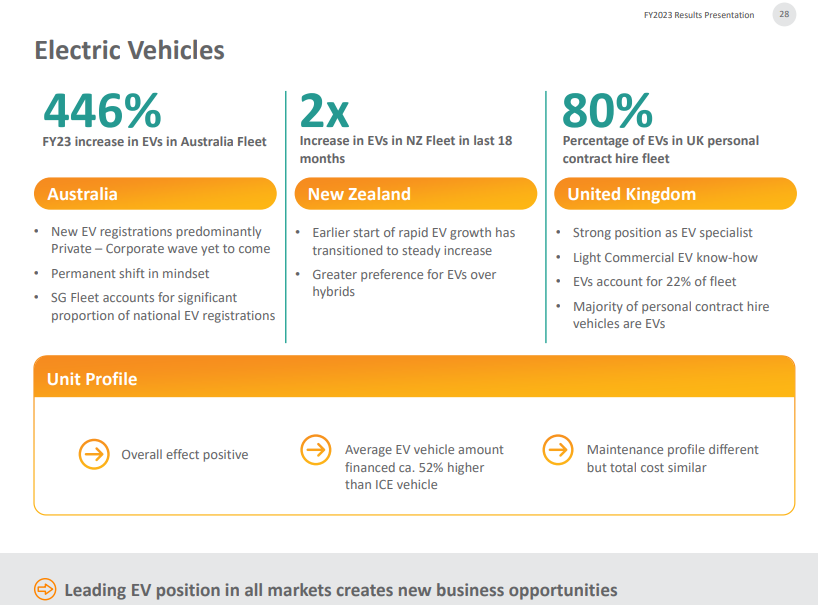
Rapid acceleration in demand for EVs
• Continued growth in quoting for ICE vehicles confirms EV is attracting new customer segment
• SG Fleet novated employer and driver profile supports EV take-up
• Demand to persist beyond current incentives and across multiple lifecycles
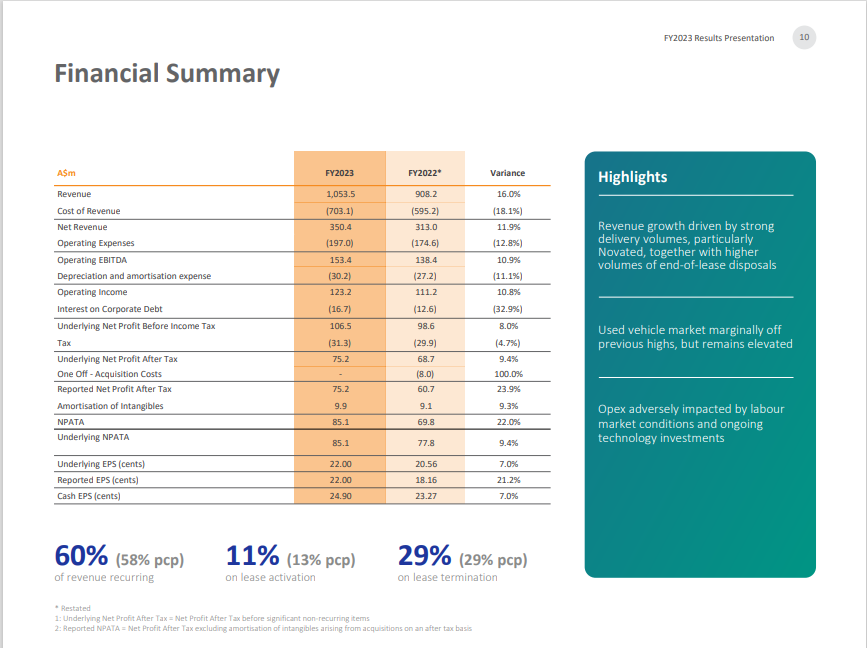
Revenue growth driven by strong delivery volumes, particularly Novated, together with higher volumes of end-of-lease disposals.
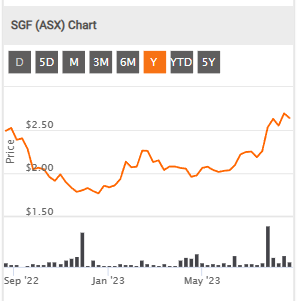
SGF Return (inc div) 1yr: 14.40% 3yr: 23.83% pa 5yr: -0.13% pa
SGF Profitable? Yes
But the Loans Alah Debt Equity is high.
Now Check the others:
MMS
SIQ
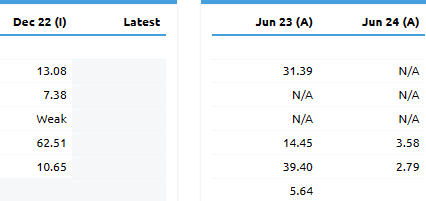
Compare Net Profit Margin Dec 2022 below:
SGF: 7.38%
MMS: 13.82% note Debt / Equity is in better position
SIQ: 26.19%