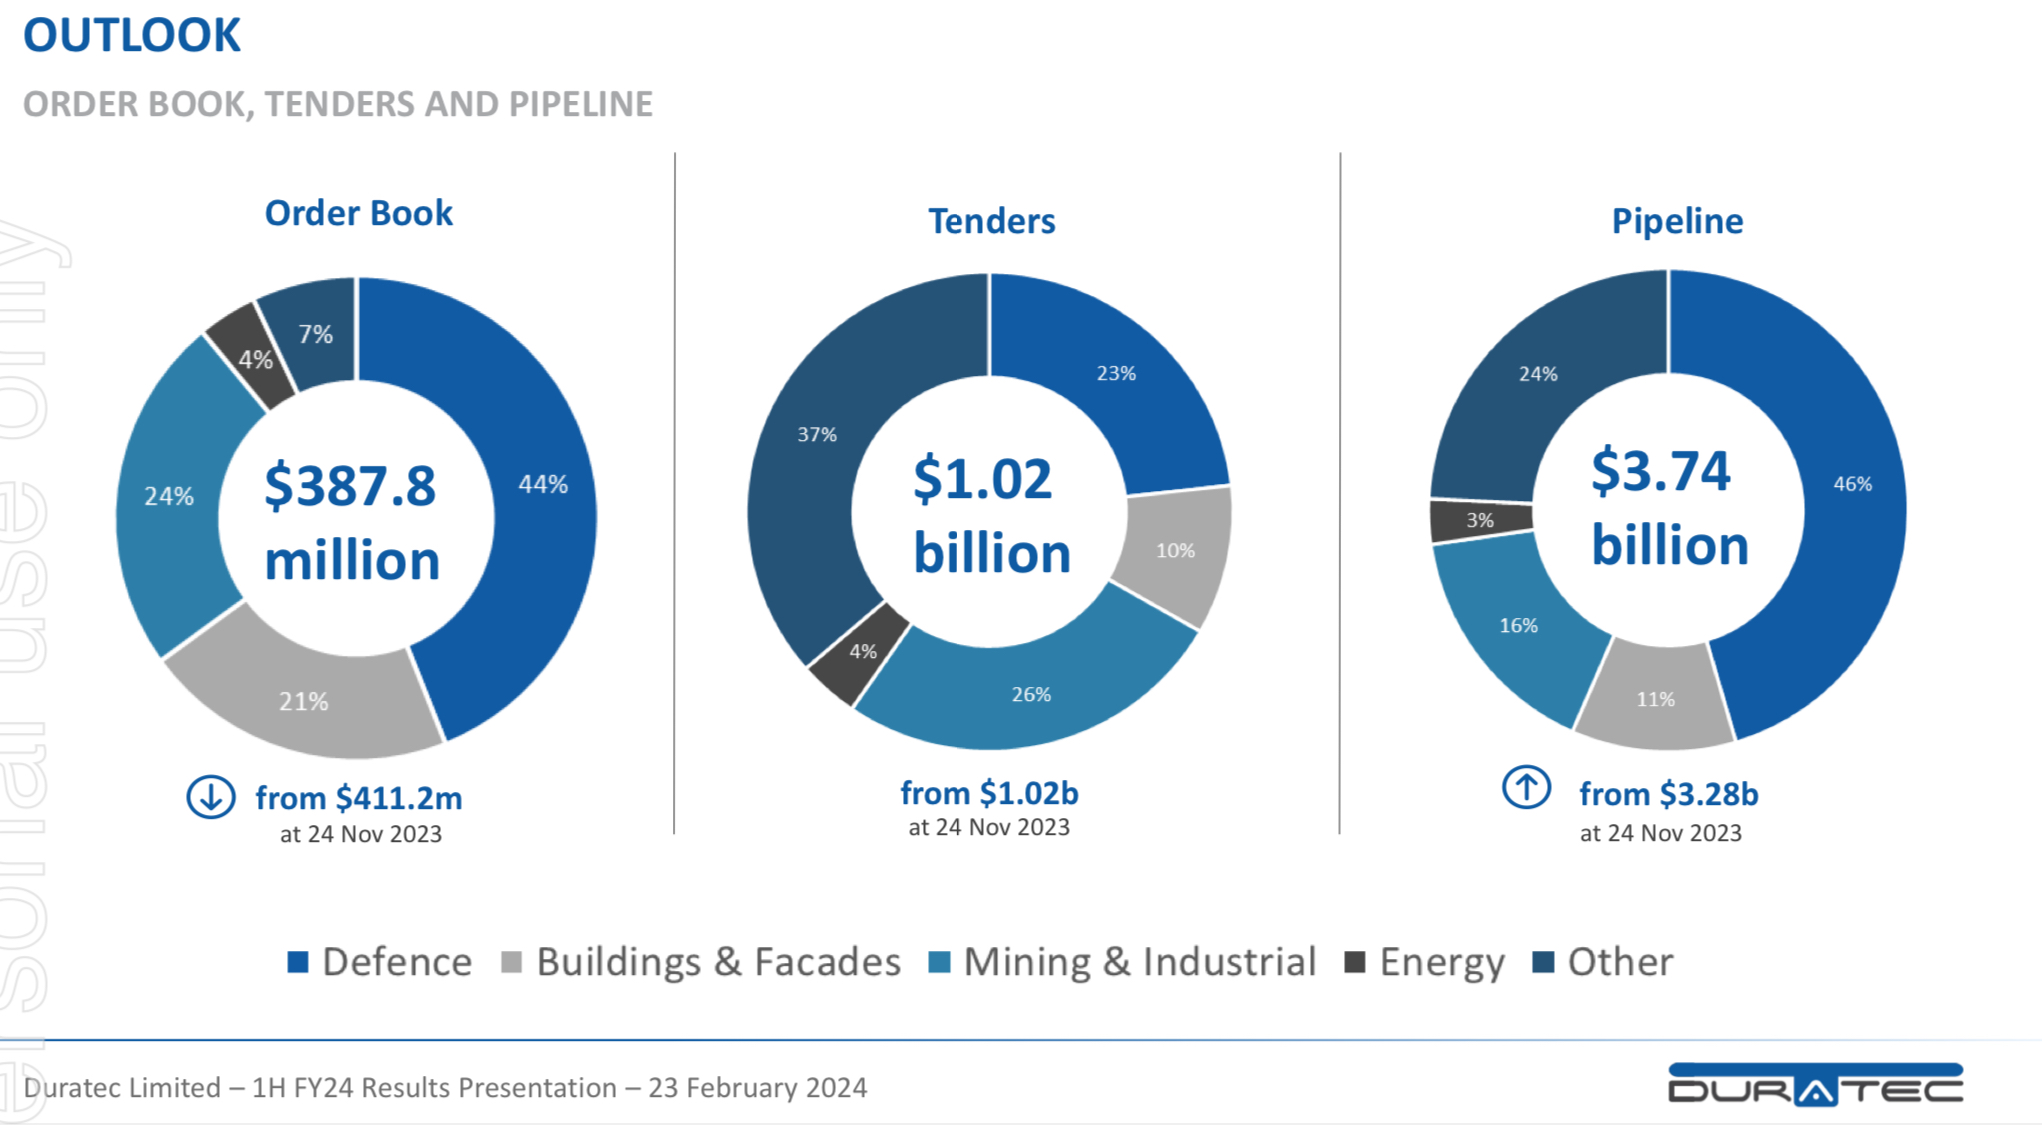
We now have a RL holding in Duratec (2.4%). I probably rushed into this a bit too early given the $388 million order book at 1H24. However, I’m here now, so it’s in my best interests to keep an eye on the pipeline of work. I am hoping to get some insight into what lies ahead to help with decisions for our holding. To help with this I’ve developed a Pipeline to Profit Model (another spreadsheet of course!).
Since listing, Duratec has consistently reported the dollar values for the pipeline of work, tenders and the order book for each half year. They have also reported EBITDA, NPAT and the margins for each. This comprehensive data makes it possible to model the historical dollar flows from pipeline to profit, and to see if there are any relationships that might be useful in forecasting profits. If they were to stop providing this data I think that could be an orange flag.
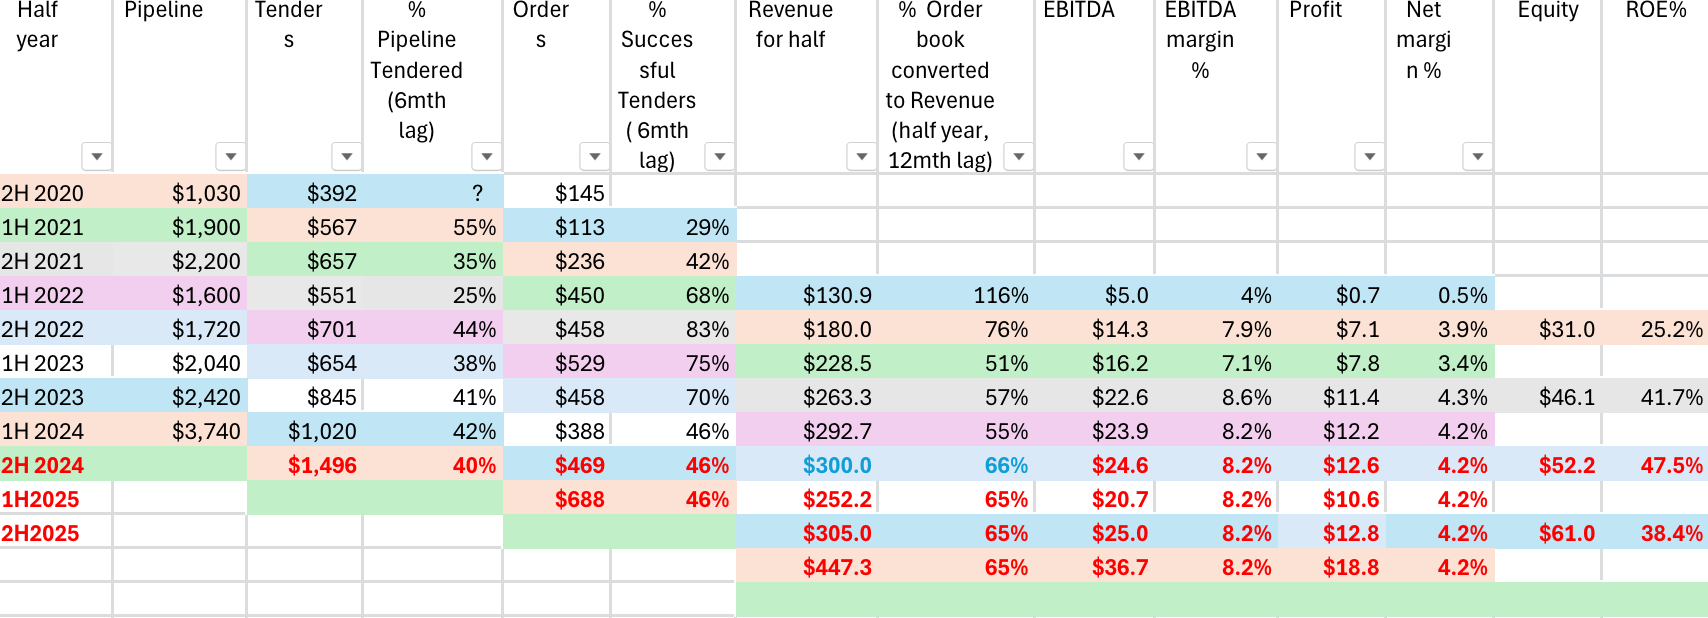
In the spreadsheet below I’ve modelled the dollars flowing from pipeline to profit assuming average lag times between each stage, noted in the column headers. I’ve assumed lag times of 6 months from pipeline to tenders, 6 months from tenders to order book, and 12 months from order book to revenue. This assumes an average lag time of 2 years from pipeline to profit, which sounds too short, but it will serve to test the model. I think the model could be very rubbery at this stage, but it’s somewhere to start and the aim is to update and improve the assumptions over time.
I’ve colour coded the dollar flows across different stages of the pipeline, and used black text for actual data, blue text for guidance, and red text for forecasts.

Analysing the conversion percentage for each stage in the pipeline, there appears to be some relationships that might be useful in forecasting profit. The conversion from pipeline to tenders ranged from 25% to 55%, narrowing from 38% to 44% over the last 2 years. For forecasting purposes I’ve assumed 40% of the 1H24 pipeline could result in tenders, ie c. $1.5 billion in tenders for 2H2024. Of course the lag times might be out of whack, and that won’t be very useful. Time will tell!
There seems to be more variability in the conversion of tenders to order book (contract wins). The conversion rate increased from 29% to 83% between 1H2021 and 2H2022, and then fell each half to 46% for 1H24. That means less than half of the projects tendered for resulted in a contract. It would appear that Duratec has become more focused on maintaining margins than in winning additional contracts, which is a good thing. Assuming 46% of the tenders would result in contracts, the 2H2024 order book could be c. $470 million.
Conversion of the order book to revenue has ranged from 51% to 66% for each half year. This makes sense as you might expect more than half of the order book would be converted to revenue each half year in the year/s of delivery due to the order book growing (not shrinking?). I’ve assumed 65% of the $388 million 1H2024 order book would be converted to revenue in 1H2025, resulting in 1H2025 revenue falling to c. $250 million. NPAT might be c. $10.6 million using a net margin of 4.2%. Based on this model NPAT could fall from c. $24.8 million in FY2024 to $23.4 million in FY2025 (5.6% lower).
The next update to look out for will be Duratec’s guidance for FY24. Last year this was released on 24 April 2023. We should have an update on the order book within a month, and hopefully it’s up on the $388 million at the 24 November 2023, or that could spell trouble!
Last year the FY23 results all came in at the top end of the upgraded guidance provided in April 23. I like to see this with guidance. I think Duratec is in for a record profit this year, but it’s the order book, the pipeline of profits, the margins and the ROE that we need to be watching.


 More cash than debt (Source: Simply Wall Street)