Company Report
Last edited 4 weeks ago
PerformanceCommunity EngagementCommunity Endorsement
ranked
#2
Performance (45m)
-5.2% pa
Followed by
280
Price History

Premium Content

Last edited 2 months ago
Valuation

Premium Content

Notes

Premium Content

Straws
Sort by:
Recent
Content is delayed by one month. Upgrade your membership to unlock all content. Click for membership options.
#FY25 Guidance
Added 4 weeks ago

While I didn't attend the $DUR AGM today, I've noted they have issued guidance as follows:

  • Revenue: $600-$640m (FY24= $555.8m), so +11.6% at midpoint
  • EBITDA: $52-$56m (FY24 47.6m), so +13.4% at midpoint


Updates on portfolio (compared with FY24): are Orderbook $409m ($405m), Tenders $1500m ($1400m), and Pipeline $4.1bn ($3.8bn).

Note the Orderbook excludes annuity-style MSA work, which is becoming more important over time.

My graph below showing as % of revenue, with "AGM" based on the FY25 Revenue Guidance midpoint.

My Assessment: Steady as she goes.

Disc: Held in RL and SM

26ae16c3e34bd146267bd1afc461d3238aa5d6.png


#ASX Announcements
Added 2 months ago

$DUR announced the award of two ECI Defence contracts at HMAS Stirling to its 50:50 JV with Ertec, with values of $10m ($1.9m and $8.1m).

While immaterial for FY25, the deliverie phases will be in FY26 and FY27, and will be more material for the ultimate winner.

Judging by the muted market reaction, I'd highlight a few points:

  • For engineering and construction infrastructure projects, the design and planning phase is typically 5%-10% of the ultimate project cost. (Can be lower, can be higher, depending on scope and scale, and how detailed the design deliverables are.)
  • So, in the success case we are talking about projects probably worth order of magnitude $100-$200m, or $50m-$100m net to $DUR.
  • ECI involvement in design and planning gives the contractor a strong inside edge leading up to the bidding for the execution phase. Essentially, they are advantaged in being able to more precisely determine execution risk, leading to a better bid. This isn't always true, as a competitor could misprice risk on the downside (particularly if they were desperate for work!) However, with the market still pretty tight in infrastructure contractiing, that is less likely. Given this knowledge assymetry, clients often don't take ECI contracts to market, and instead have an independent advisor review the project proposal.
  • To quantify, this potentially moves $DUR from a 25-30% CoS (without ECI) to a >70-80% CoS on ultimate award, with more certainty on the project margin ultimately achieved.
  • $DUR are increasingly using their MEND capability to get better scope definition in early design. They'll no doubt be using it here, and it is a real edge over competitors who don't yet have the capability.


So, while not material for FY25, it is leading up to a potentially nice piece of work for 2026 and 2027.

$DUR has had a very strong SP run over the last 6 months, so anything other than a very material project award (>$100m) is probably unlikely to move the dial.

But good news, nonetheless.

Disc: Held

#FY24 Results
Added 4 months ago

Asset remediation and maintenance specialist $DUR announced their FY24 results.

ASX Announcement

Their Headlines

  • Record Revenue of $555.8m (up 13%)
  • EBITDA of $47.6m (up 22.6%)
  • NPAT of $21.4m
  • Gross profit 17.3%, up from 16.7% in FY23
  • Strong cash on hand of $65.2m, with a cash conversion of 84% in FY24
  • Annuity style contracts of $145.8m, making up ~26% of revenue
  • Improved order book with quality tender opportunities continuing to grow
  • Early Contractor Involvement (ECI) presenting significant opportunities across the business


My Analysis

The result was well-guided to at the end of May.

NPAT growth of 11.6% is well below what we've seen in recent years/underwhelming, but meeting expectation. Note: the analyst TP is about +21% ahead of the market, so room for SP to continue to advance (if you believe that means anything!)

Net Margin % of 3.9% the same as FY23 - so managing costs and commercial exposures well. (And better than FY21 3.0% and FY22 2.5%)

I include the updated picture on pipeline - slight increase in order book. The continuing build in Tenders bodes well for the year ahead. "Pipeline" is more a "whatever you want number" - but being high means they have line of sight to lots of work, and therefore can be selective in bidding for jobs that play to their strengths.

Joining the call at 11am.

Overall looks good.

Disc: Held in RL and SM

35cc731b9afc681d9c7211cd230e8ba6bdcc8a.png


#Business Model/Strategy
Added 4 months ago

Sometimes (actually often!) when screening companies and then doing the deep dive prior to initiating a position, important details don't really sink in properly.

Shareholders of $DUR will today have received the latest edition of the company magazine, and one aspect of it really made me sit up and pay attention (turn to pages 20-21.)

While I understood that $DUR was extending its core focus of asset remediation and extension to the energy sector, via the acquistion of WPF (Wilson's Pipe Fabrication), its passed me by how significant this move is in the context of the challenge over the next 2-3 decades of decommissioning Australia's offshore oil and gas facitilies. (This is actually embarassing, because I have been involved for 25+ years in the energy sector!!) By this I mean that I noted the scope potential, but didn't fully grasp the materiality or the opportunity or the broader strategic fit for $DUR.

"There are more than 1,000 oil and gas structures in Austrlian water. The Australian Petroleum Product and Exaplorations Association (APPEA) estimates that decommissioning these facilities could cost $50 billion over the next 30 years."

So the penny dropped: a deep core corporate capability in existing asset remediation and extension + an acquired oil and gas industry construction capability + innovative tech in remote asset mapping (MEND) - which will be hugely applicable in the offshore environment.

There are also multiple barriers to entry in this sector: Offshore + Oil & Gas.

This is a major potential multi-decadal growth driver for $DUR and I didn't properly consider this in my investment thesis. Some oversights are fortuitous!

Disc: Held in RL and SM

#Broker/Analyst Views
stale
Added 7 months ago

Moelis have updated their valuation on $DUR following the guidance update earlier this week, bringing the valuation down from $1.62 to $1.50.

Analyst Report (ASX free broker report service).

The shift in the Moelis model is instructive, with the valuation now at a 37% premium to today's close of $1.095.

While its towards the lower bound of my valuation range, for brevity, I'll post this as my valuation on SM.

The report notes that the major $450m tender for the Defence Garden Island works, in which $DUR has a 50% interest in the JV alongside strategic partner Ertech. This will be a key test of 1) the ability of $DUR to win major work with a core repeat client, and 2) evidence of the competitive edge achieved through the ECI model. (I'd almost go so far as to say it is central to the thesis - but that would be overstating the case.) In any event, newflow on this in FY25 will be key.

Disc: Held in RL and SM (BTW, I did add the second 2% tranche in RL, so now holding RL 4%)

#Project Management HR
stale
Added 9 months ago

Part of my potential investment thesis for $DUR is a belief (or rather a question) that its more stable business compared with sector peers allows for better talent management and, as a result, industry outperformance.

** I've referred to this analysis in previous posts. It didn't clearly indicate what I though it might, but as I know several StrawPeople are interested in $DUR (and other firms referenced), so I have gone ahead and written it up. **

$DUR performs less cyclical work (compared with sector peers) due to its focus on asset refurbishment and life extension. This should enable better workforce management and career development, which in turn should drive higher performance than sector peers. If the firm is well-managed, this should lead to it retaining a cadre of key project management and engineering personnel, who understand its systems, processes, scope types and clients. This part of the potential thesis derives from my career exposure over 30 years to capital projects, where a common (universal!) factor in project underperformance is the capability of the project management team. A key capability and performance driver is staff turnover. High staff turnover leads to "hiring risk" including misalignment with company culture and processes, in addtion to performance/capability factors. These are major contributors of project underperformance, which can be very material.

I conducted an analysis, via data-mining LinkedIn profiles, of staff at $DUR in the key populations of:

  • Project Management: including Project Managers (PM), Senior Project Managers and Site Managers. These are the key roles responsible for delivery of contracted scopes of work.
  • Operations Managers and Area Managers: roles which oversee multiple project teams within a geographical area and/or industry vertical.


As well as measuring tenure at the firm, the analysis looked for evidence of career progression and development of individuals, e.g., project engineer-to-project manager-to-operations manager.

For the PM population, I conducted a parallel analysis at industry peer $LYL – a known high performer in the sector (covered extensively here by @Bear77 and @Rick ). $LYL faces the additional challenges of being more exposed to the commodity cycle, delivering more work through contractors, and having a more diverse international portfolio of mining projects.


Key Findings

Far from showing stable workforce tenure at the Project Manager (PM) level, if anything, $DUR tends to show a high level of PM turnover (avg. tenure = 3.2 yrs), even after making some allowance for portfolio growth (adjusted avg. tenure 3.5yrs). (This compares with an average tenure of 7.7 yrs of the equivalent population at $LYL)

In the PM population, staff at $DUR have held on average held 1.5 roles (1.8 at $LYL) at the firm.

However, $DUR appears to compensate for high PM turnover via the management layer of Operations Managers (OM) and Area Managers (AM). Holders of these positions demonstrate both longer average tenure and there is a strong propensity to appoint people to these roles who have developed through the ranks at $DUR. OMs and AMs have nearly always previously held one or more Project Management roles. For staff in these roles, average tenure at $DUR is 6.3 years, with staff having held on average 2.5 positions at $DUR. Importantly, of the 23 staff in this population, only 2 have been hired externally at this level in the last 3 years, with all others have been developed internally.

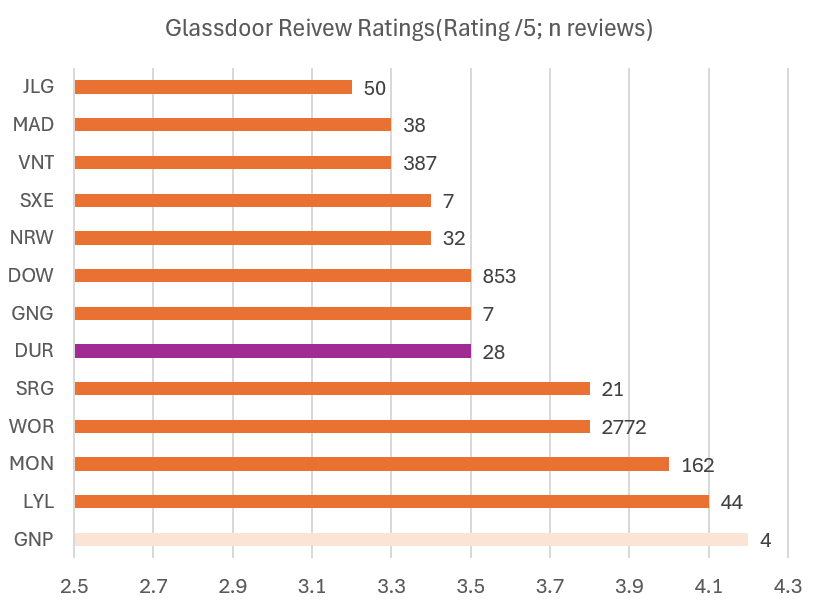
Finally, from an analysis of Employee Reviews at Glassdoor.com, the average $DUR rating = 3.5 is in line with the Industry Average (3.5-3.6 - see note at end of Straw), indicating $DUR is not distinctive in people management. (See graph at end of Straw)


Conclusion

There is no evidence, based on this analysis, that $DUR is distinctive in the management of its cohort of key project management professionals. Therefore, there is no evidence to indicate that better project management capability will drive industry outperformance in this area. The differentiated people management part of the potential investment thesis is not supported.

Limitations

The methodology was based on measuring the time employees have remained employed with the firm. While high turnover in the engineering and construction industry is one indicator of management capability and company culture, it is not a perfect indicator. Indeed, it is perfectly arguable that an underperforming firm and management team may have long tenured staff, e.g., by failing to manage performance effectively.

Secondly, Glassdoor reviews are susceptible to manipulation by management. (e.g., Management/HR teams encouraging managers and targeted high performers to submit reviews). Some of the firms also have a small population of reviews, and the scores can be disproportionately skewed by a small number of “outliers” for whatever reason.

Figure 1: Glassdoor Reviews Analysis
46ed1230b3b2a37a983667872f942e91d93c1e.png

Analysis of data in graph:

Review-weighted Industry Average = 3.69

Review-weighted Industry Average (ex-WOR) = 3.51

Unweigthed Industry Average = 3.61

I have cited 3.5-3.6 as a better Industry Average for small/mid cap firms due to the dominant impact of the number of $WOR reviews in the dataset.


Interesting Unintended Finding

$LYL comes out looking pretty good in this analysis, so I've definitely put it on my watchlist!