Consensus community valuation
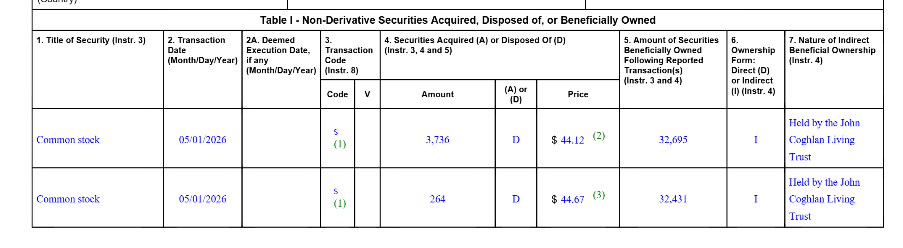
Under the Program, Life360 may repurchase shares of its common stock in the United States
from time to time in the open market over a multi-year period, at prevailing market prices, in
privately negotiated transactions, in block trades, and/or through other legally permissible
means, depending on market conditions and in accordance with applicable rules and
regulations (including through Rule 10b5-1 trading plans and under 10b-18 of the Exchange
Act). The timing and amount of repurchases will be determined at management’s discretion
based on market conditions, share price, liquidity, and other factors. The Program does not
obligate the Company to acquire any specific number or dollar amount of shares and may be
suspended, modified, or discontinued at any time.
So the repurchase of common stock will make the mathematics better for the ROE. less common stock will make 360 profitability look nicer.
1. Base Case: Steady Scaling
- Key Drivers: Assumes Life360 hits the midpoint of its FY26 guidance ($135M Adjusted EBITDA) and maintains a 20% growth rate for five years.
- Context: This aligns with the company's "multi-engine" strategy where core subscriptions remain steady and advertising begins to contribute more significantly.
- Valuation: Leads to an intrinsic value of A$25.54, suggesting the stock is currently undervalued by roughly 25% compared to its recent trading price of ~$20.
2. Bull Case: Advertising Dominance
- Key Drivers: Assumes 25% growth, driven by the Nativo acquisition. It projects that advertising revenue, which recently grew 329% YoY, becomes a dominant profit engine with high margins.
- Context: In this scenario, Life360 successfully increases the conversion rate of its 70M+ free users into paying or high-value ad users.
- Valuation: Results in a target of A$34.26. This is close to the Bell Potter price target of A$35.50.
3. Bear Case: Competitive Saturation
- Key Drivers: Assumes growth slows to 12% due to privacy regulation or intensified competition from big tech (e.g., Apple/Google family features).
- Context: This case accounts for the "softness" in Q1 MAU growth (<20%) noted by some analysts as a potential sign of market saturation.
- Valuation: Drops the fair value to A$17.03, slightly below the recent 52-week low of A$16.90.
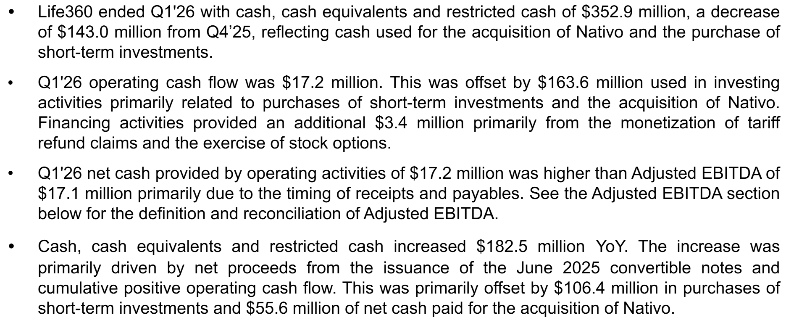
From below: Life360 Reports Record Q1 2026 Results
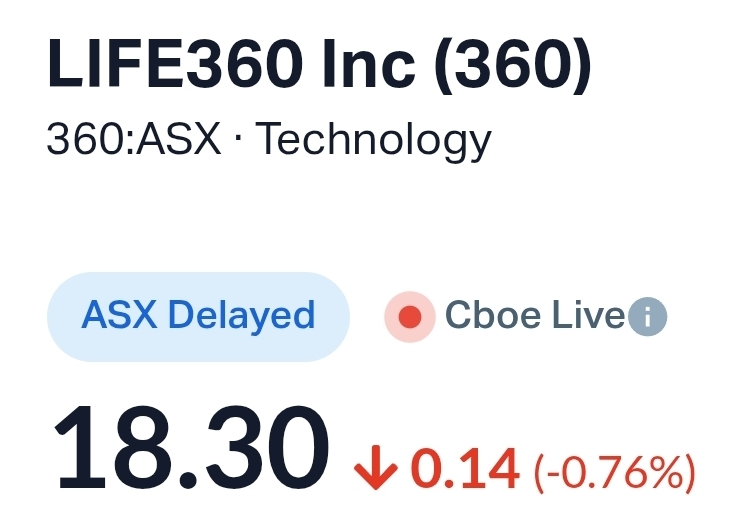
Small amount of securities disposed of here, but trades lower
360:Return (inc div) 1yr: -10.49% 3yr: 58.14% pa 5yr: 28.78% pa
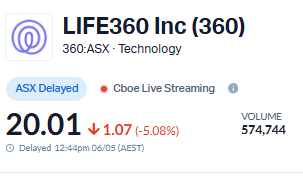
But shares trade lower today:
Could be at equal 'Risk' here and find support at around $20 per share
Let the straw people know about the Pets,
Consumerism:
Getting Started with Jiobit for Pets Beta in the Life360 app
Jiobit for Pets Beta is a GPS Tile tracker designed to help you monitor your pet in the Life360 app, no matter where they wander. It offers peace of mind with real-time location tracking.
Note: Available to members in the US only. A Life360 Gold annual membership is required.


Jiobit is Out of stock:
https://www.amazon.com/Jiobit-Lightweight-Resistant-Real-Time-Long-Lasting/dp/B0BG38VSK8
Published 15/08/2025, 01:12 am
Market Position and Competition
Life360’s freemium business model has been identified as a key strength, creating significant competitive moats and lowering customer acquisition costs. The company’s unique position in the market, offering real-time location sharing and communication services specifically tailored for families, has allowed it to maintain strong growth with minimal direct competition.
International Expansion
Life360’s international growth has been particularly impressive, with international MAU growing by 35% year-over-year. The company has seen strong performance in international metrics, including MAU and ARPPC growth. This global expansion is expected to continue, with the upcoming launch of pet-related services in international markets set to drive further growth
Bear Case
How might macroeconomic uncertainties affect Life360’s growth?
While Life360 has shown resilience in the face of economic challenges, macroeconomic uncertainties could potentially impact consumer spending on subscription services. Economic downturns might lead to reduced discretionary spending, potentially affecting the company’s ability to convert free users to paying subscribers or retain existing premium users..
Bull Case
Life360’s strong international MAU growth of 35% year-over-year demonstrates significant potential for global expansion. As the company continues to localize its offerings and tailor its marketing strategies to different regions, it could tap into large, underserved markets.
The planned launch of pet-related services in international markets in Q4 2025 could accelerate this growth, providing a unique selling proposition in new territories. Additionally, the company’s experience in navigating different regulatory environments and cultural norms around location sharing and privacy could give it an advantage as it expands globally.
International expansion also provides an opportunity to diversify revenue sources geographically, potentially reducing reliance on any single market and providing a hedge against regional economic fluctuations
SWOT AnalysisThis analysis is based on information available up to August 14, 2025.
Strengths:
Strong user growth and engagement
Unique freemium business model with low customer acquisition costs
Valuable first-party location data
Diverse product offerings (location sharing, communication, pet tracking)
Weaknesses:
Dependence on app store policies for distribution and payments
Potential privacy concerns related to location tracking
Reliance on subscription model in a competitive app market
Opportunities:
Expansion into pet tracking and elder care services
International market growth
Increased monetization through advertising and partnerships
Integration of Tile technology for expanded tracking capabilities
Threats:
Macroeconomic uncertainties affecting consumer spending
Potential new entrants or increased competition in the family safety app market
Changes in app store policies or regulations regarding data privacy
Technological changes affecting location tracking or smartphone usage
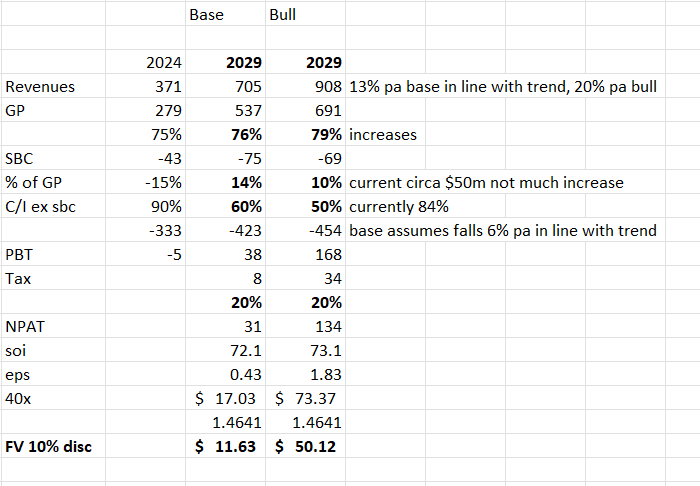
I haven't looked at this one for a few years. It was around $ 4 per share then, and my conclusion was that it had potential. However, knowing my luck, I felt that two weeks after I invested in it, AAPL or GOOG would decide to end 360's life. Maybe that's wrong; maybe the TAM here is just too small for the big boys to bother with, and it ends up as a small, growing, profitable niche or sells out. Whatever, so i decided to do a valuation based on a forward estimate of the 2029 P&L under a base case and bull case scenarios. main assumptions, and there are a few in bold. the most sensitive is the cost ratio on a mature basis or operating leverage, in other words. The conclusion is a very wide range of outcomes.
I'm interested in any Bulls' views on what they see differently.
if anything in the post-GFC investing world, we see winning biz models keep winning and valuations lag, so I'm following this one, its likely to be volatile given the sensitivities.
Monthly Active Users Reached Approximately 88.0 million; Up 25% Year-Over-Year Record Q2 Global Net Additions of 136 thousand Paying Circles, Reaching 2.5 million Total Total Quarterly Revenue Increased 36% Year-Over-Year to $115.4 million Annualized Monthly Revenue Increased 36% Year-Over-Year to $416.1 million
Full-Year Outlook for Revenue and Adjusted EBITDA Raised Based on Year-To-Date Performance SAN FRANCISCO, California. Life360, Inc. (“Life360” or the “Company”) (NASDAQ: LIF, ASX: 360), the provider of the market leading family safety and connection mobile application, today announced unaudited financial results for the second quarter (“Q2”) ended June 30, 2025.
Motley fool article below, before the Tuesday Results say:
Life360 results
Life360 Inc (ASX: 360) shares will be on watch today when the location technology company releases its second quarter update. According to a note out of Bell Potter, its analysts are forecasting a 29% increase in revenue to US$109.1 million and a 16% lift in adjusted EBITDA to US$12.8 million. This is expected to be driven by a 26% jump in global monthly active users to 88.6 million and a 24% increase in paying circles to 2.52 million.
I see Life 360 hit the targets in Q2: Users 88Mill, Reach 2.5mill, Revenue of $115.4mill exceeded expectations.
https://hotcopper.com.au/threads/ann-sec-form-8-k.8707720/
Below Life 360 actually has a positive eps of $0.09
Net income: $7,000.000
Weighted av' ord' shares: 76.797,385 ( eps = net profit / # ord' shares)

some slides from the presentation>


Return (inc div) 1yr: 128.42% 3yr: 95.35% pa 5yr: 59.68% pa

Friday: 360 finished up 7% so that warms the heart..
https://hotcopper.com.au/threads/ann-q424-media-release.8470818/

https://hotcopper.com.au/threads/ann-q424-investor-presentation.8470836/


Financials:


Uber joins the platform as a key partner, integrating with Life360's Landing Notifications to provide timely transportation options and launching targeted ads to parents of teens for Uber teen accounts. These accounts allow teens aged 13-17 to request their own rides and order food, all with parental supervision and essential safety features built into the experience.

To help bolster the growth of the Life360 Advertising Platform, the company has appointed Google veteran Brian McDevitt as its first-ever Vice President of Ad Sales and Strategy. McDevitt will focus on building, scaling, and running Life360's ad business globally.
I found some information below:
Life 360 Blog: 5 Uber Safety Tips for Women | Ride Sharing Safety | Life360
Life360: Live Location Sharing – Apps on Google Play
Life360: Find Friends & Family on the App Store (apple.com)
Compatibility
iPhone
Requires iOS 15.3 or later.

Disc: I don't currently use the 360 app
Disc: RL
Life 360 Opened at $17 , gapped up. Traded positively on the NASDAQ last night. Trading above $17.00 this arvo.
Snap shot of the opening trades here:
Dics: holding
Life360 Chief Financial Officer Russell Burke noted, “We continued to take meaningful steps on our path to profitability during the quarter, and our U.S. IPO enhanced our strategic flexibility.” Burke continued, “While costs from the U.S. IPO impacted our Net Loss versus the prior year, we achieved our seventh consecutive quarter of positive Adjusted EBITDA1 , and our fifth consecutive quarter of positive Operating Cash Flow.
Our commitment to balancing growth with expanding profitability was reflected in our Q2’24 results, as our total revenue reached $84.9 million and grew 20% YoY, while our total operating expenses increased 12% YoY.
We remain on track to reach our target of sustained positive EBITDA1 in 2025.”


San Francisco area-based Life360, Inc. (Life360 or the Company) (ASX: 360) today announced the launch of its initial public offering in the U.S. (the “Offering”) of 5,750,000 shares of its common stock.

Slide 3 Life360 met or exceeded all of the guidance metrics we provided to the market for 2023. Revenue growth of 33% to $304.5 million, benefited from continued strong momentum in our subscription business, with revenue increasing 44% year-on-year. At the same time, GAAP operating expenses increased just 4% YoY, and reduced 1% YoY when excluding variable sales commissions, reflecting a disciplined approach to cost.
The strong revenue growth combined with cost restraint ,underpinned a greater than $60 million yearon-year improvement in each of net loss, EBITDA and Adjusted EBITDA to $(28.2) million, $(20.8) million and $20.6 million respectively. A similar $60 million improvement in operating cash flow delivered the first full year of positive cash flow of $7.5 million.
Life360’s balance sheet is strong, finishing the 2023 year with cash, restricted cash and cash equivalents of $70.7 million.


I thinking .. We promise the profits.....
Return (inc div) 1yr: 122.56% 3yr: 36.57% pa 5yr: 30.15% pa

Months Total operating expenses are up (Mill) 66,392 Vs 64,722
So Expenses vs Revenue 'game'


360: down 9% at open today

Life360 has commenced CY24 with strong operating metrics. Global Monthly Active Users (MAU) were 66.4 million at the end of CY24 Q1
Market Update reaction : up 16.9% this morning


Return (inc div) 1yr: 185.48% 3yr: 44.14% pa 5yr: N/A

John Philip Coghlan Chairman
2023 Performance Life360 met or exceeded all of the guidance metrics we provided to the market for CY23.
Revenue growth of 33% to $304.5 million benefited from continued strong momentum in the core Life360 subscription business, which increased 52% year-on-year.
At the same time, GAAP operating expenses increased just 4% YoY, and reduced 1% excluding variable commissions, reflecting a disciplined approach to cost.
The strong revenue growth combined with cost restraint underpinned a greater than $60 million year-on-year improvement in each of net loss, EBITDA and Adjusted EBITDA to $(28.2) million1 , $(20.8) million and $20.6 million respectively. A similar $60 million improvement in operating cash flow delivered the first full year of positive cash flow of $7.5 million.
Life360’s balance sheet is strong, finishing CY23 with cash, restricted cash and cash equivalents of $70.7 million.
Rerview Life360 is a leading technology platform used to locate the people, pets and things that matter most to families. Life360 is creating a new category at the intersection of family, technology, and safety to help keep families connected and safe. The Company’s core offering, the Life360 mobile application, includes features that range from communications to driving safety and location sharing. The Life360 mobile application operates under a “freemium” model where its core offering is available to users at no charge, with three membership subscription options that are available but not required. Our platform recently entered a new era of location tracking services with the successful acquisitions of Jiobit and Tile. By offering devices and integrated software to members, we have expanded our addressable market to provide members of all ages with a vertically integrated, cross-platform solution of scale. For the years ended December 31, 2023 and 2022, Life360 generated: • Total revenues of $304.5 million and $228.3 million, respectively, representing year-over-year growth of 33%; • Subscription revenues of $220.8 million and $153.3 million, respectively, representing year-over-year growth of 44%; • Hardware revenues of $58.2 million and $47.9 million, respectively, representing year-over-year growth of 21%; • Other revenues of $25.5 million and $27.1 million, respectively, representing year-over-year decline of 6%; • Gross profit of $222.6 million and $148.6 million, respectively, representing year-over-year growth of 50%; and • Net loss of $28.2 million and $91.6 million, respectively. Key Factors Affecting Our Performance As we focus on growing our customers and revenue, and achieving profitability while investing for the future and managing risk, expenses and capital, the following factors and others identified in the section of this Annual Report on Form 10-K titled “Item 1A. Risk Factors” have been important to our business and we expect them to impact our operations in future periods: Ability to Retain Trusted Brand. We strongly believe in our vision to become the indispensable safety membership for families, with a suite of safety services that span every life stage of the family. Our business model and future success are dependent on the value and reputation of the Life360, Jiobit and Tile brands. Our brand is trusted by approximately 61 million members as of December 31, 2023, and because we know the value of trust is immeasurable, we will continue to work tirelessly to ensure that we provide useful, reliable, trustworthy and innovative products and services. Attract, Retain and Convert Members. Our business model is based on attracting new members to our platform, converting free members to subscribers, and retaining and expanding subscriptions over time. Our continued success depends in part on our ability to offer compelling new products and features to our members, and to continue providing a quality user experience to convert and retain paying subscribers. We will also seek to increase brand awareness and customer adoption of our platform through various programs and digital and broad-scale advertising. Maintaining Efficient Member Acquisition. Our investment in developing effective services and devices creates an efficient member acquisition model which drives strong unit economics. Our member acquisition model is complemented by our word-of-mouth and freemium models. We accelerate our organic member acquisition with strategic and targeted paid marketing spend. We expect to continue to invest in product and marketing, while balancing growth with strong unit economics. As we continue to expand internationally, we may increase our targeted marketing investments.
Return (inc div) 1yr: 168.03% 3yr: 40.48% pa 5yr: N/A
- Revenue up 33% to US$305 million
- Subscription revenue up 52% to US$200 million
- Adjusted EBITDA of US$20.6 million
- Net loss of US$28.2 million
- Cash and equivalents of US$70.7 million
For the 12 months ended 31 December, Life360 reported a 33% increase in revenue to US$305 million. This was in the middle of its guidance range of US$300 million to US$310 million.
A key driver of this growth was its core Life360 subscription revenue, which came in at US$200 million. This was up 52% year on year and ahead of guidance for a ~50% increase.

Some Slides Below:


equivalent to approximately US$4 million.

Chris Hull Holding: circa 1,647,061 units
J.P. Coghlan: 201,408 units

3Month Trend Bearish.


Noted: Refer to Annexure!!!!!!!!!! "Com On", I want percentage here.......
Normally the result is in Percent.


Revenue YOY up 34% and Subscription revenue up 66% YOY


As of Monday 13 March 2023, U.S. time, the Company has regained access to its funds in SVB accounts, and is transacting normally.

SVB It seems – again, we don’t know for sure – that SVB had a similar problem, but rather than being caught out on the availability of funding, like in the GFC, it was rising rates that may have been responsible.
Rising rates (yields) pushes down the value of long term, low-rate bonds. (If you bought a 10-year US Treasury at 2% in the past, no-one is going to buy it off you at face value because they can buy a newer bond at, say, 3% or 3.5%. That means your bonds are worth less.
So a lesson: Don't buy bonds especially when the rates increase ...move from low to high rate environment. Leave it to the experts...lol..
by:Understanding the collapse of Silicon Valley Bank (fool.com.au)
As of March 10, 2023, the Company had cash and cash equivalents of approximately $95.1 million, including $6.1 million in deposits with SVB, and $75.4 million in shares of money market mutual funds managed by Morgan Stanley, Blackrock and Western Asset, which are invested in short-term, AAArated U.S. Government Treasury and Government Agency securities. Although SVB acted as custodian of these accounts, the Company understands that these accounts were not co-mingled with SVB’s assets. As a result, the Company expects that the FDIC should act to liquidate the funds and disburse these amounts, or otherwise make the funds available, to the Company (subject to FDIC confirmation of customer ownership) in the near term, but timing has not been confirmed by the FDIC.


CY23 total revenue growth currently expected in the range of 35% YoY. Positive Operating Cash Flow and positive Adjusted EBITDA1 is expected for the full year CY23


Number of securities: 9,845,930 Voting power: 5.28%

For Android - Google Play & Apple - App store 
Chris Hulls, Co-Founder and CEO, and David Rice, COO, of San Francisco-based Life360, Inc. (Life360 or the Company) (ASX:360) will today participate in Bell Potter’s Technology Decoded Conference. The conference presentation is attached.
Return (inc div) 1yr: -48.50% 3yr: 13.13% pa 5yr: N/A
We will see how the investors react to this today. Nasdaq up overnight so could be / should be trading ok.
link: 2924-02565580-2A1397298 (markitdigital.com)


Tile Integration: on Life 360 web page. there are no hints on the Holiday Season offering? Membership offering no clarity on the offer claims ( roadside assistance, Nurse help line .. ect ) on page 19 here.
360 web page: INT'L: Plans & Pricing - Life360

So download & check the features - for the family safety.
Reviews:
1/ Tracking My Teen Driver with LIFE360 HONEST REVIEW at https://youtu.be/ZkQZQp9PoyU
2/ Life 360 GPS Family Tracker App Real Family Review. at https://youtu.be/Q9k4n3QfL4s


still growing Total MAU Quarterly : 35.5mill up to 38.3mill
Average Revenue per subscription growth - ok


- Release Date: 05/08/22
- Summary: Becoming a substantial holder from CGF at 6.36% voting power.
