Consensus community valuation
Private markets coming for the ASX - interested to see Australia has held up despite the commentary.


I posted this Chart of the ASX200 to another member yesterday and thought others might be interested in this also
Yersterdays comments below:
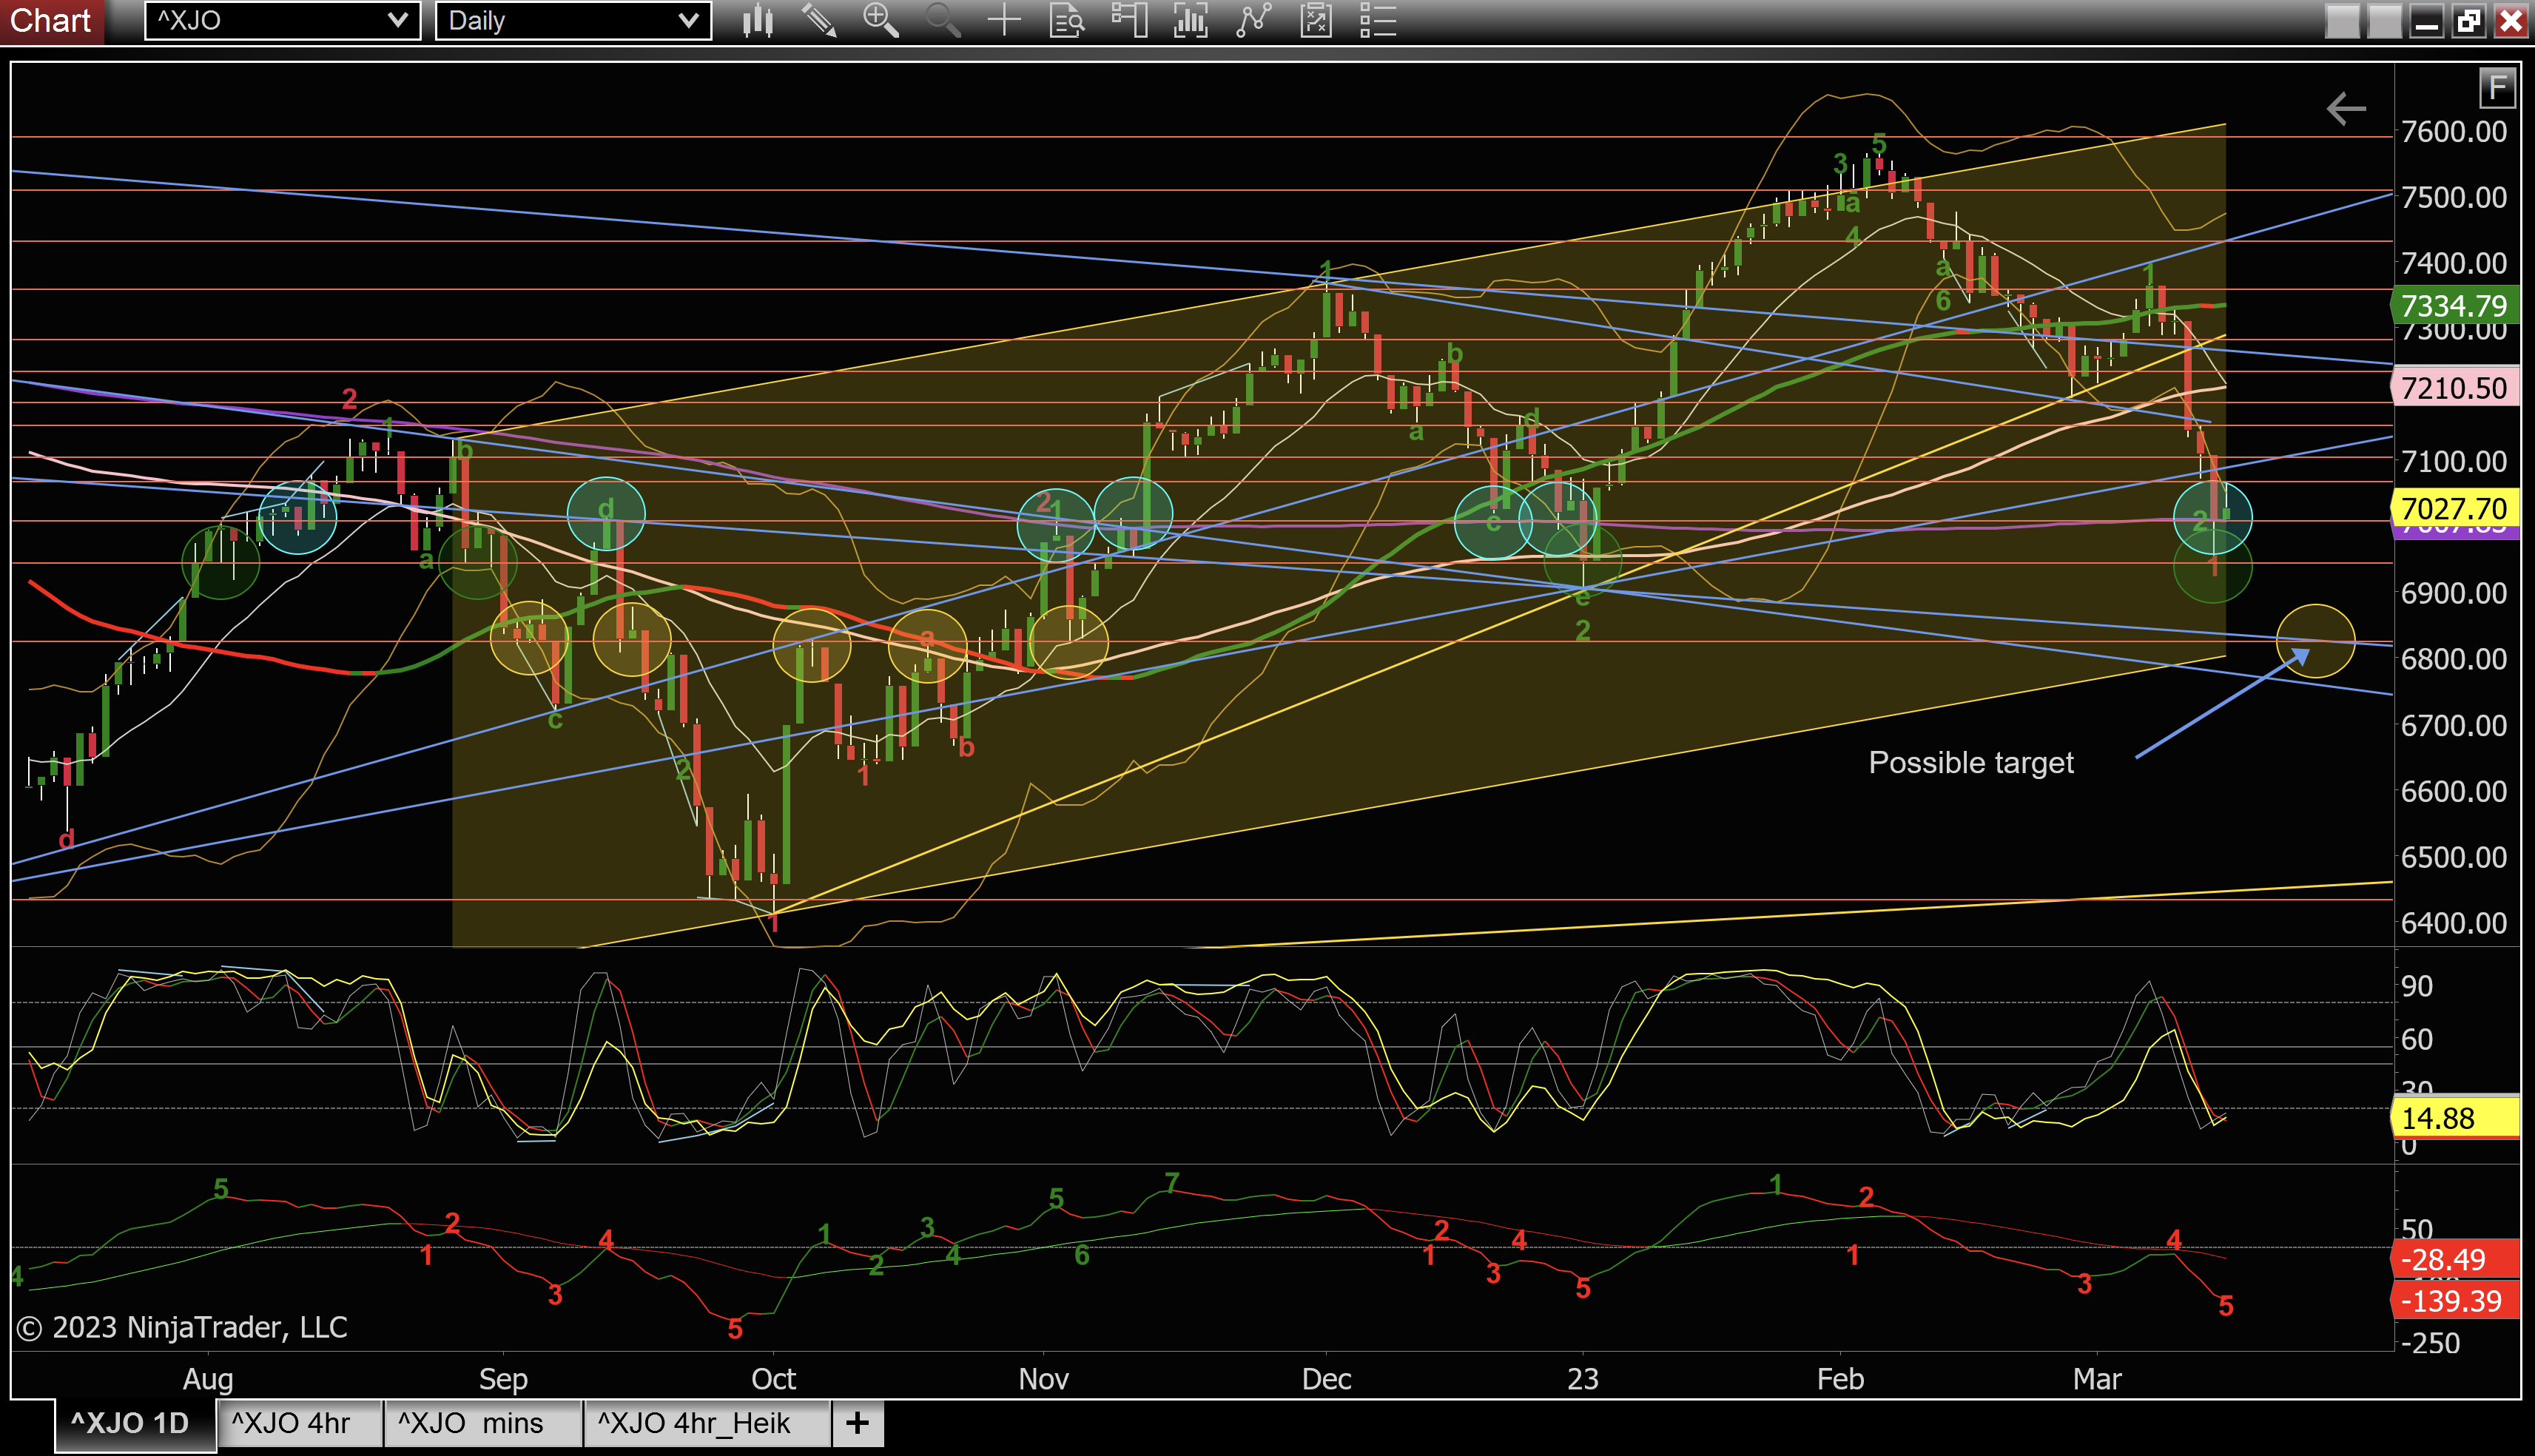
Here is graph of the ASX200 note the 3 different colour circles where the bars have come right to them and stalled or hit and bouced way way or another. The Yellow circle on the red support line have been very convincing and the market certainly watches this red support level. I beleiv we have seen the last of the drop. It may wiggle up a little, maybe even meet the 15 to test though I feel it will drop at least the the recent bottom again to test it again (Im pretty certain) and possibly might make all the way down to my possible target. Depending on whwre the market is up too in its cycles, That 6825 mark is definitely and area to watch. It has support there as well as the intersection of a Trend line (Blue) and the bottom of the long term channel the market has been trading in. For now though I'm thinking it will drop again to test the 6945 mark.
Yesterdays Chart:
Other wonder why Im so heavily into Charting, well its because it Gives me a feel of whats going on in the market in a broard sence. Even if the Stocks Im interested in arnt part of the ASX200, the mood across the market will tell me when and when not to take positions (most of the time).
Have a look at the 4hr yesterday, especially the last couple of bars and the Stochastic Indicator.
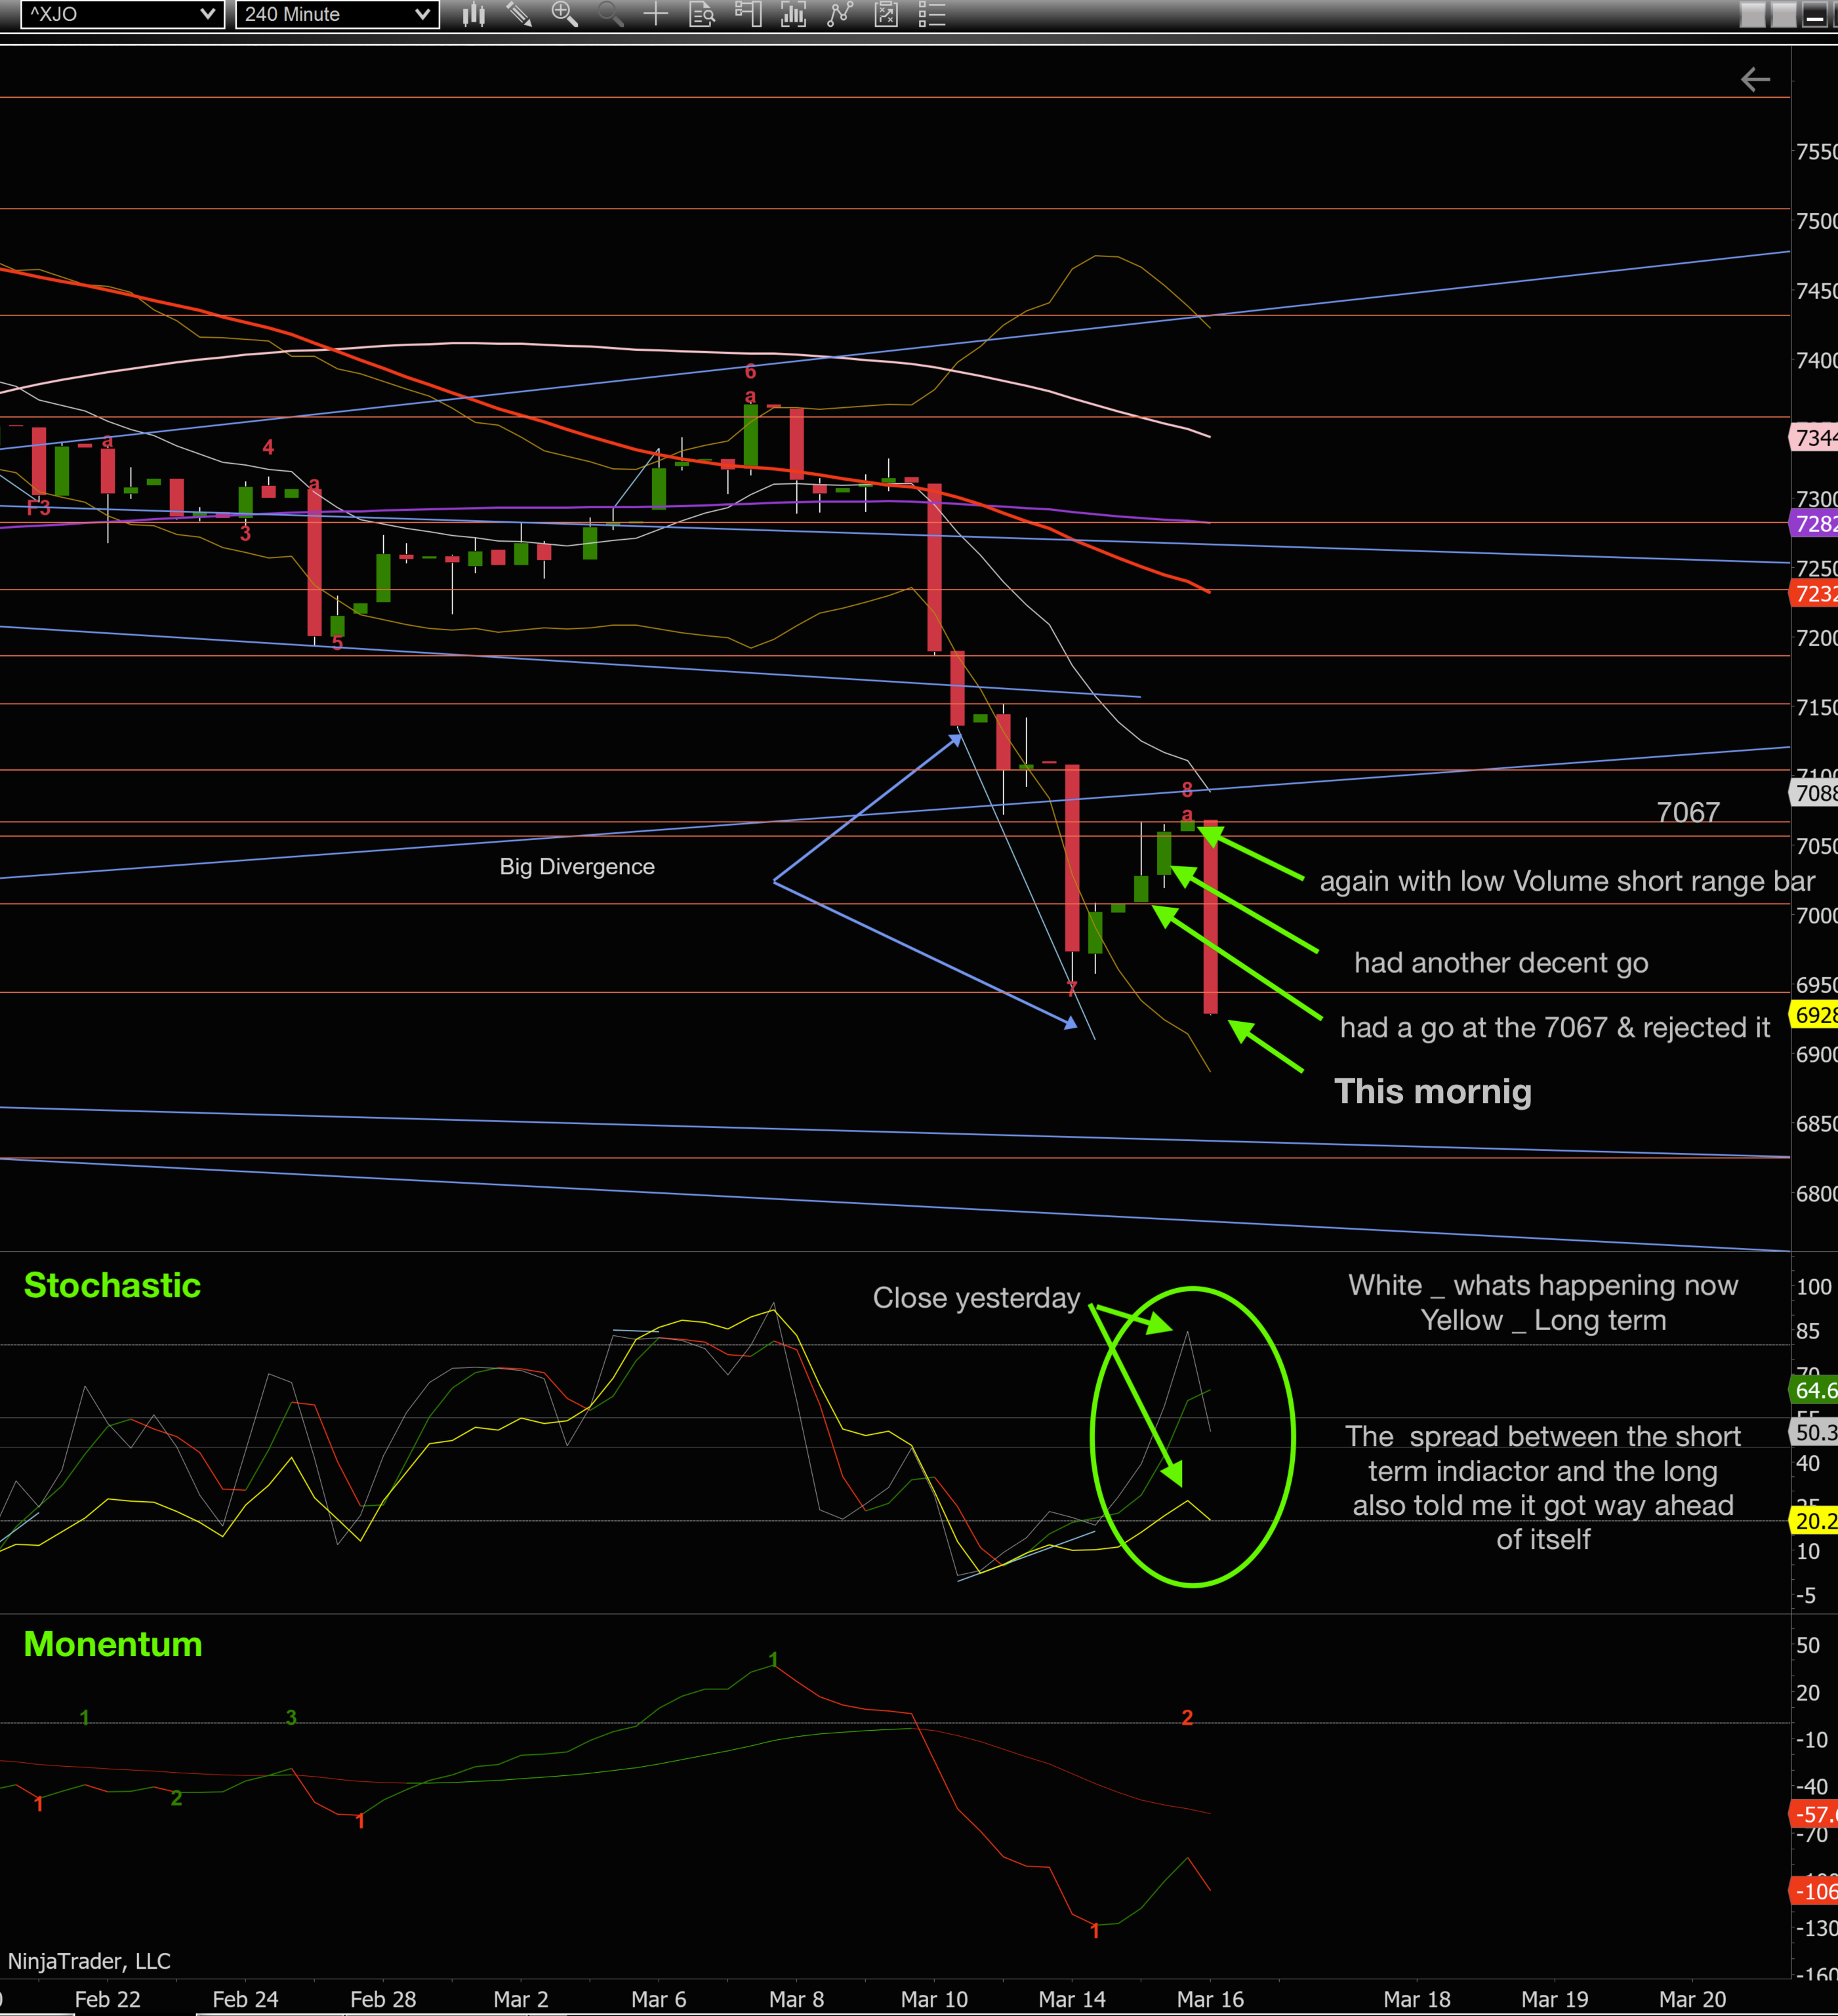
The 4hr says it all.
What Im also saying is my chart set up is nothing special. Its something you all have access to as well. Takes a little to setup but well worth it.
Im also of the mind this isnt the bottom. Have a look back at my 1Day chart at the top. Im thinking the market will go there and at least have a decent retrace if not lift from there. That gives me a bit of timing on when to look seriously as to my next move.
Hope this provides so help for those that are interested. It also may pull back today and Create a Double Bottom. Who knows
Last time I wrote about a correction likely to occur in the market with the 1D charts showing it had got ahead of itself. It corrected itselff across the 3 days starting on the 29th & droppedd approx 200 point in the 3 days. Now I see a bigger drop on its way soon as can be seen on the 3D chart ahead of itself shown in the Yellow Circle (the white line is far to ahead of the yellow longer term line). When these discrepancies happen on the longer time frame charts (9 days in my case) it means it will take longer to correct itself. This could result in larger sudden drops in the market or, it drops back slowly over a long period of time. Either way be carefull with positons you have taken recently. They should be considered short term trades as they may be whipped out and turn negative. If you bought in for the long term, then note we are still in a bearish market. My thought is we have further to fall overall even though we have enjoyed a recent up tick. Dont be fooled that the market has turned yet. My thoughts on this is positions I'm taking at the moment are for small short term gains, which I probably wont be sitting on for the long term. Macro Finacials of AU and the rest of the world are still very much negative and I beleive it will be that way for some time to come. I think we will see the 6430 point region visited again over the next month or so on the ASX200 (asx code is XJO). Here is a screen shot for you all of what my charts are looking like currently.

Not only is the white short term indicator line way ahead of the longer yellow one, the yellow longer time frame indicator line is completly flat. I would have expected to see it rising even if in a weak fashion. Thats all for now. Good luck everyone and keep a cool head. Dont let emotion creep in to your decision making.
Be carefull over next weekish. Could be looking aat a decent drop again people on the ASX200. My 1D graph isnt looking so good. I always come to this chart before I make any decent size trades to get a feeling of how things are travelling.
Question for you all. Does anyone know the code to look at the futures maket over all or for the individual futures sectors?
