


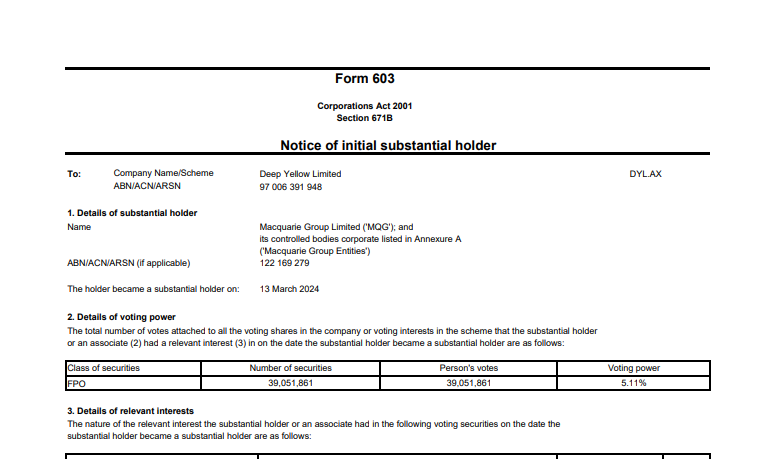
Macquarie Group Limited ('MQG')
What is Macquarie doing buying into DYL Uranium? - Are they shorting this DYL?
- A look back at 27/07/23:


*Difficult for the 'Millionaires Factory " the increasing high interests is the wrong environment for MQG the strategy.
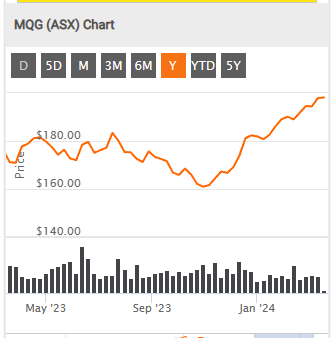
 Return (inc div) 1yr: 2.99% 3yr: 16.67% pa 5yr: 11.59% pa
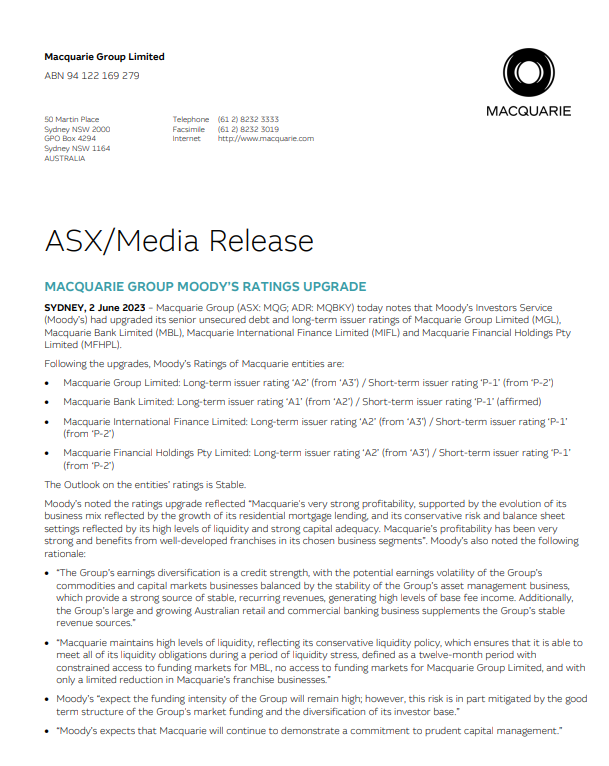
Glenny's report a bit here:
Mr Stevens said “The Group delivered a record profit of $A5.2 billion, for a return on shareholders’ equity of 16.9 per cent. This was an exceptional outcome, achieved by a high-performing management team who deliver for shareholders by delivering for clients.
Macquarie’s diversification was again evident – even as some business lines faced difficult trading conditions, others were able to expand profitably by servicing a growing client base
MQG below:
 Return (inc div) 1yr: -1.24% 3yr: 19.43% pa 5yr: 13.19% pa
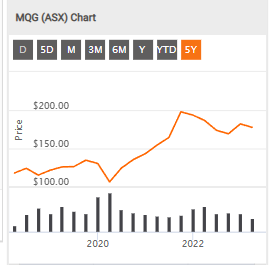
MQG Return peak to trough is 100% 1- 2 = $200/$100
Compare Growth performance:
While here - A look at CBA over the last 5 years.
Conclusion: MQG vs CBA ends up at the same destination in recent times..........x Return( inc Div ) Compared..
MQG - i guess, can have certain assets that generate returns. CBA and the big 4 have more banking rules around how they can grow their assets., to grow profitability.
CBA chart Below:
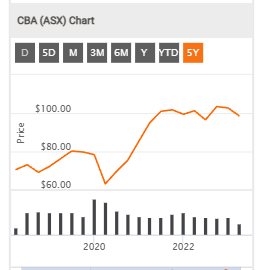

CBA Calculate from the chart here:
Peak to trough is 66% 1- 1.666 1.666'=100/60
( so CBA less growth 66% vs MQG 100% ..not including dividends ...)