


I have been holding onto a lot of cash 30-40% of funds available to be allocated to the market, waiting for the market to turn back towards positive sentiment. I haven't purchased anymore NDQ since early 2020 as I have just been letting it run. Looks like the recent downtrend has potentially turned so buying in line with my dollar cost averaging strategy for ETFs with the momentum (ie. don't buy a downtrend) overlay.
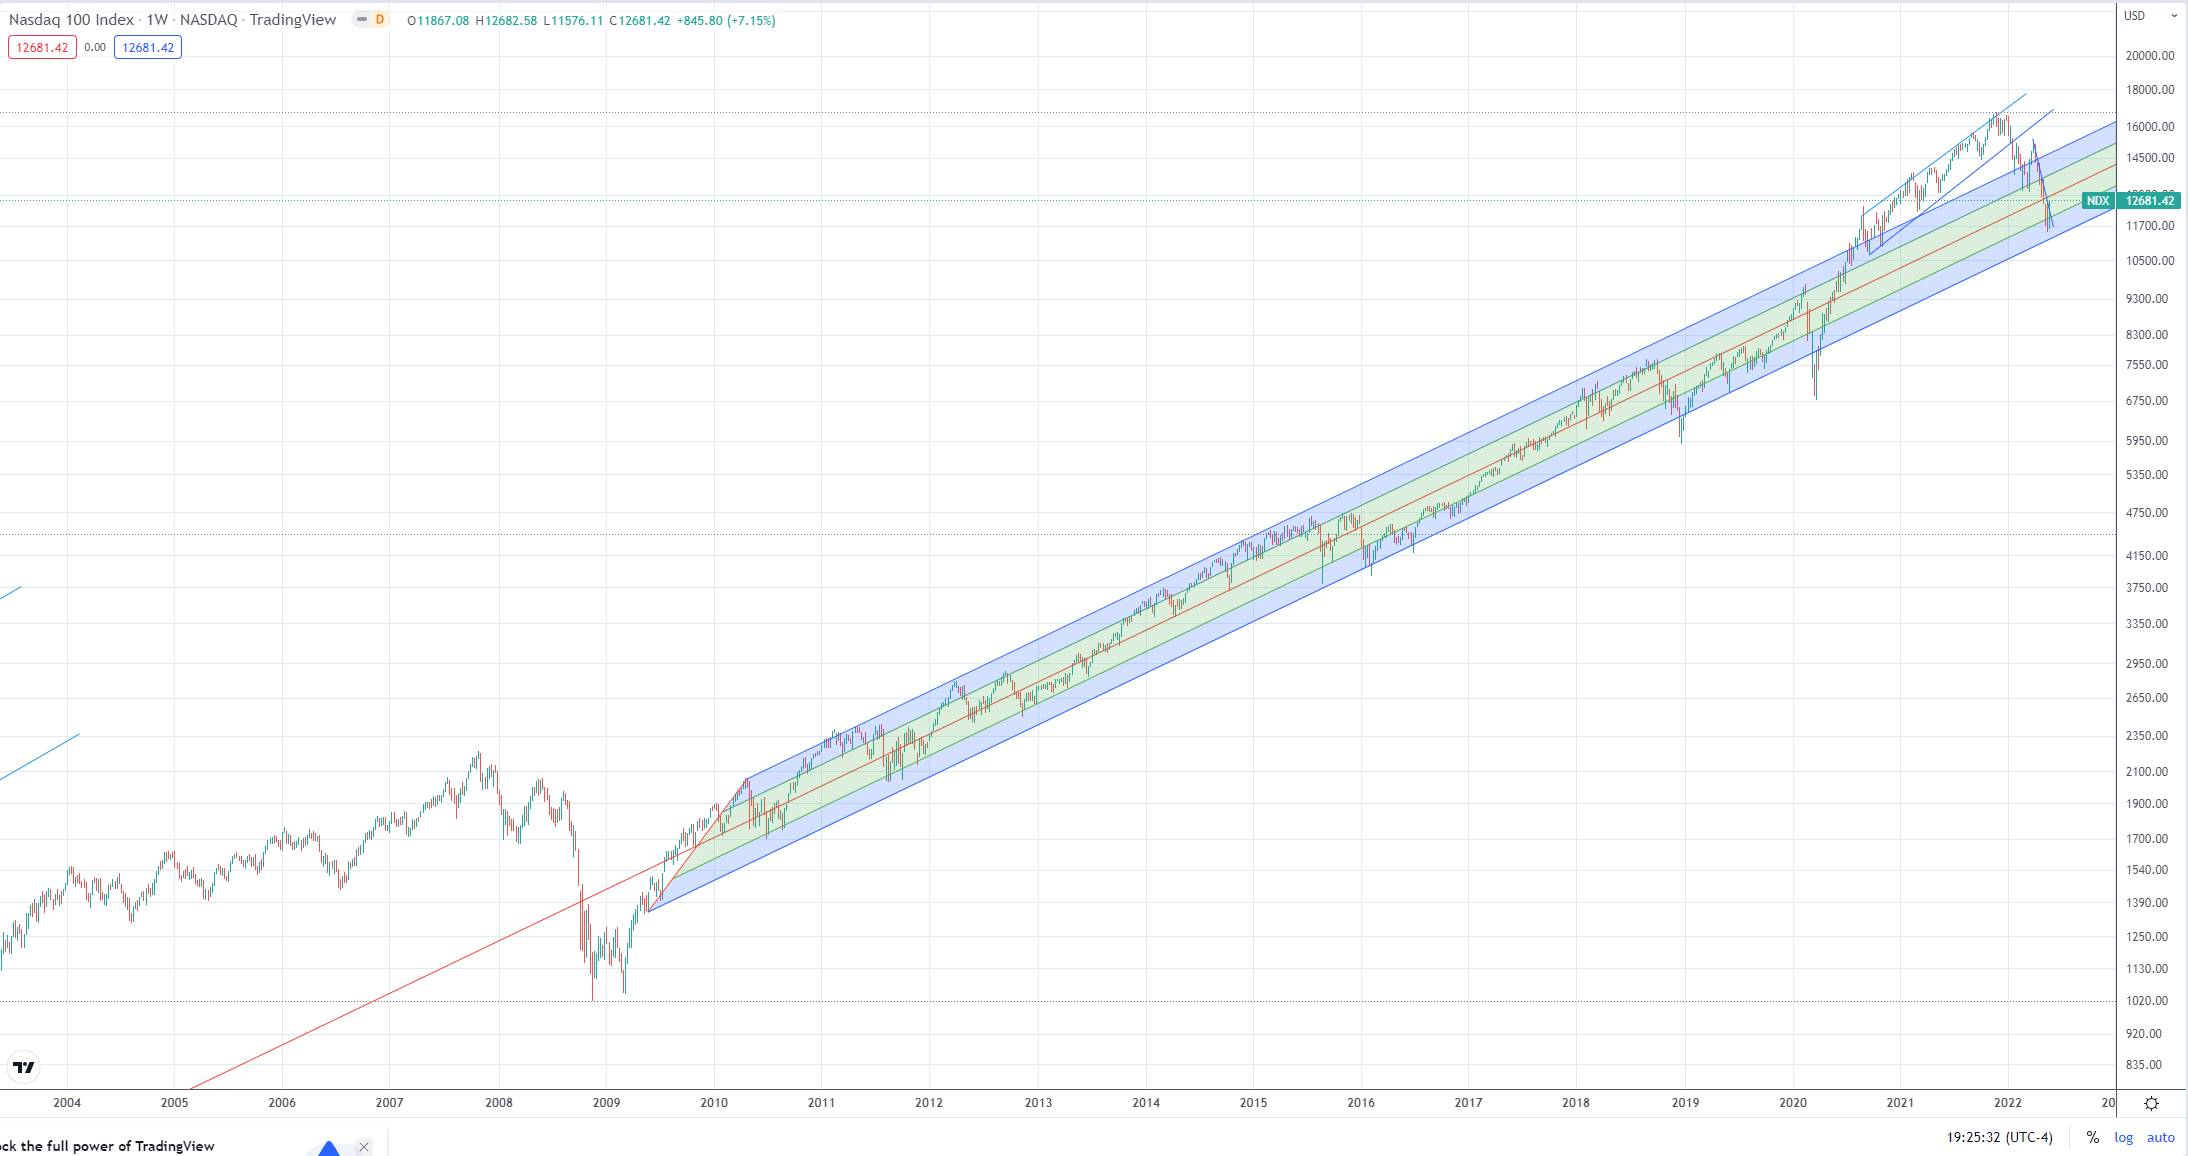
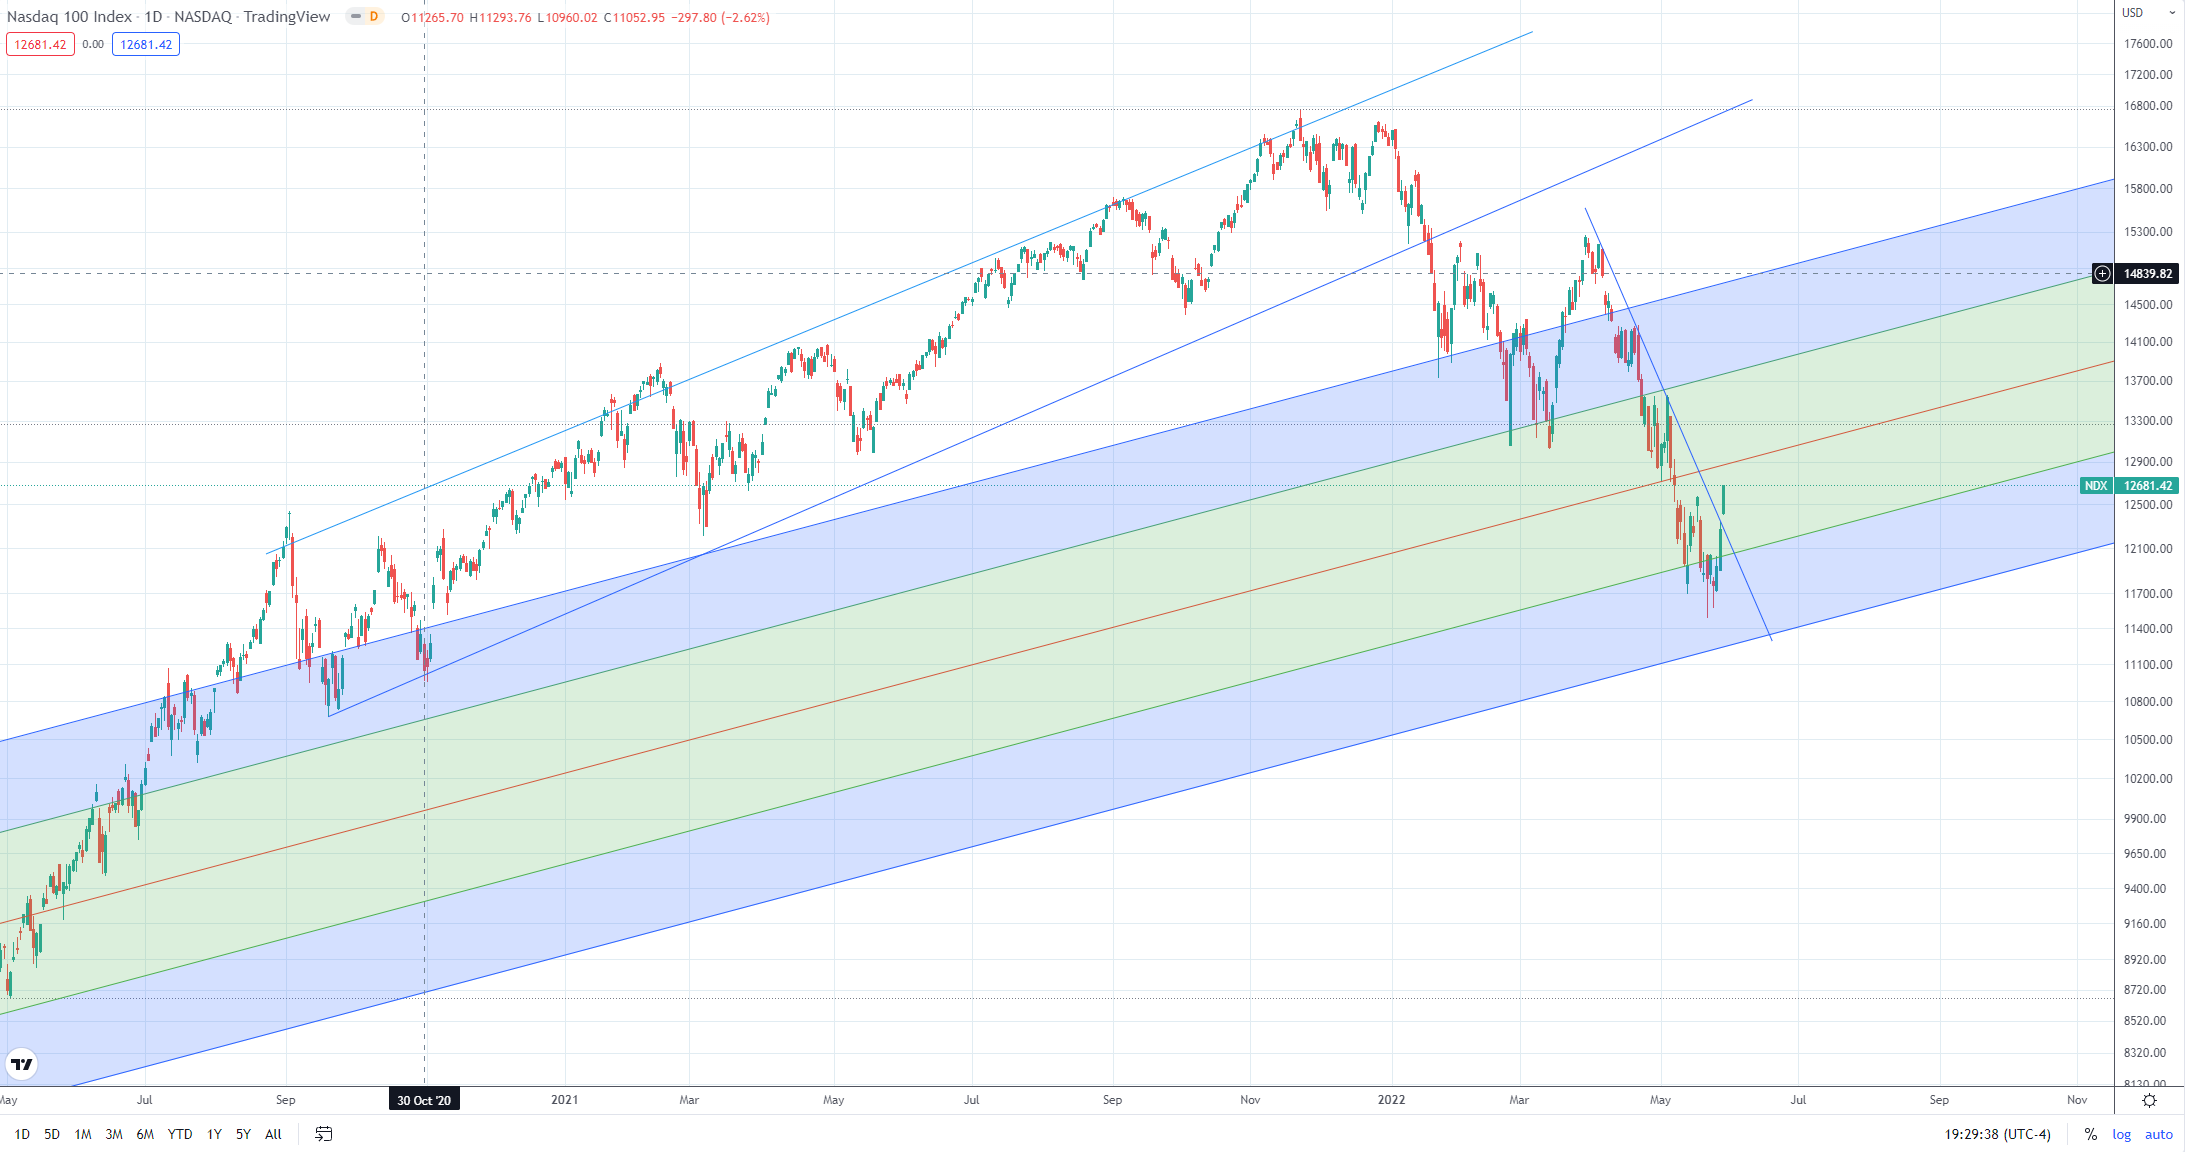
Charts show a decent point to buy either way given the channel in which the Nasdaq 100 has traditionally sat in between since 2009. Buying after reaching the bottom blue channel almost always goes on to higher points in a short amount of time whereas buying during a period in the higher blue zone normally results in lower returns over the short term (1-2 years) and therefore average return over the longer term. The assumption that could change and that needs to be kept in mind is that the Nasdaq may not continue to grow at the 17ish% yearly average return that it has generated for the last 10+ years.
Notes on charts below, log scale used, first chart is longer term and second is a 1-year chart.
Disclosure: My Strawman portfolio I tend to only hold individual companies rather than a reflection of my RL portfolio which holds at least 50% ETFs/managed investments. Also, I am absolutely no technical analysis guru!!! Just looking for the most basic and obvious trends from a chart. Happy to be corrected on the technicals!