


Price History
Premium Content
Premium Content
Premium Content
Discl: Held IRL 9.15%
SUMMARY
This was another robust quarter for NWL, but with clear moderation of the growth from the previous 2 quarters and with market volatility taking away a good chunk of Net Inflows of both FUA and FUM.
New Accounts continued the moderation across the last 3 quarters following a big jump in new accounts in 4QFY25 - while the trend is not the prettiest, this feels more like normalising towards the longe term trend rather than a shrinking growth concern.
Despite market volatility noticeably adversely impacting FUA and FUM market movement, Total FUA and Total FUM grew sharply vs pcp, QoQ was growth was mostly flat, but both stayed marginally above trend.
Looks like good sustained momentum - no concerns with the underlying trajectory and momentum of the business.
No change to FY26 guidance, which given current trajectory, should be very much achievable, given that 4Q is historically NWL’s strongest Quarter.
NEW ACCOUNTS
- Continued below trend increase in new accounts of 4,454, up 2.6% QoQ, up 13.4% vs PCP
- Despite market volatility, FUA per account increased 6.5% over the pcp to $712k

TOTAL FUA, TOTAL FUM
- Nice continued above trend growth for Cumm New account
- Total FUA and Total FUM - at trend, no concerns

FUNDS UNDER ADMINISTRATION
- Total custodial Inflows of $7.9b. Up 19.4% on pcp - sustaining momentum
- Net FUA inflows of $4.0b was on trend, but FUA market movement was ($3.7b), Total change in FUA was $0.3b
- FUA net flows continued to benefit from ongoing flows from existing financial intermediaries - 41 new intermediary relationships were established in the quarter, 4,454 new accounts added

- FUA Custodial grew QoQ 0.1%, but it was the 4th consecutive quarter of above trend growth in Custodial FUA
- Non-Custodial FUA was $1.2b up 56.6% from pcp, up 7.7% QoQ
- Total FUA of $125.8b was up 20.9% vs pcp, but was up only 0.2% QoQ, flat
- Probably a short term normalising of FUA in play given that the last 2 quarters were pretty sharp upticks, but the overall trend is still looking really good

FUNDS UNDER MANAGEMENT
- FUM Net inflows was $1.3b, sharply moderating from the strength of the last 2 quarters
- Total FUM Market Movement was ($0.8b), a sharp drop given market volatility, but FUM still ended up growing $0.4b

- End of period FUM was $31.8b, up 28.5% vs PCP, up only 1.4% QOQ, flat, but very much continuing the above trend growth
- Growth of FUM, underpinned by the growth of Managed Accounts, up $0.5b up 30.4% vs pcp, up 1.6% QoQ - 34 new Managed Accounts were added, investment in new Managed Account models continue to support the growth in FUM

OTHER PROGRESS UPDATES
- The “Individual HIN” is currently in pilot phase, 2 private wealth firms onboarded, on track for broader market release in July - this is primarily designed to unlock TAM of ~$600b FUA from the Australian broking market
- Implemented significant Anti-Money Laundering (AML) and Know-Your-Customer (KYC) regulatory changes and new onboarding experience to strengthen compliance and risk management
- Deployed AI training across the business for all staff
OUTLOOK
No change to guidance. Unsuprising as the business is tracking nicely, despite intense market volatility this quarter.
Discl: Held IRL 8.95%


Updated NWL chart. Has been consolidating for the past 1-2 weeks between 23.90 and the upper resistance zone of 25.77 and 26.32.

Discl: Held IRL 9.64%
SUMMARY
- There is strong momentum and continued growth
- Stripping out the First Guardian impact, this was a strong half for NWL, coming off the back of a strong FY25 - revenue jumped YoY +24.71% and HoH +14.63% - the market clearly liked it
- EBITDA grew +23.95% YoY and +13.20% HoH, above trend, with EBITDA margin sustaining at 49.9%
- First Guardian resolution looks well progressed and should be behind the company - compensations were made, NWL took on only $70m debt instead of the full $100m
- 1HFY26 dividend rose from 17.5c to 21.0c, a 20% increase, despite the First Guardian impact
- No huge AI-eating-NWL concerns - AI is an enabler for NWL - the platform workflows are the workflows of Financial Intermediaries, there is tight regulatory requirements to comply with, data is kept closed
- Continued relentless focus on innovation to evolve and add products
- Based on current run rate and EBITDA margin, guidance for FY26 around Net FUA Flows and EBITDA margin should be met

- Stripping out the First Guardian impact, this was a very strong above trend revenue jump YoY +24.71% and HoH +14.63%
- Operating Expenses kept pace, increasing +25.48% YoY and 16.09% HoH, above trend
- Majority of this investment was in additional 127 headcount, a 19.1% increase, with empoyee benefits expense increasing $13.2m or 24.8%
- Technology-related expenditure to strengthen operational capacity and support longer-term growth opportunities
- EBITDA grew +23.95% YoY and +13.20% HoH, above trend, with EBITDA marging sustaining at 49.9%
- Cash flow conversion ratio was a strong 99.7%, but slightly short of 2HFY2025’s 103%

The increase in Financial Intermediaries and the number of accounts that they bring continue to impress.

This slide on its own was good info but was only meaningful when I graphed the Revenue Segments - Ancillary Fees growth has been accelerating.

AI, OF COURSE
I did not worry about AI eating NWL - it IS (1) the workflows of the advisers (2) data for a customer is closed and tightly regulated (2) heavily regulated system of record, but good to see management thinkig through the implications as you would expect.

Market share as of September 2025.
NWL is taking market share from both retail platforms and industry funds, as member balances grow and investors seek tailored advice specific to their needs. Can't remember this coming up before.

OPERATING LEVERAGE
Noticeable change from the language used in 2HFY25 “Operating leverage delivered in FY25”. No issues with this as these investments are resulting in the increase of revenue and broadening of the revenue segments.
Majority of this investment was in additional 127 headcount, a 19.1% increase, with empoyee benefits expense increasing $13.2m or 24.8%


FIRST GUARDIAN UPDATE
Feels like we are seeing the back of this issue.


OUTLOOK
- No change to guidance
- FY25 FUA Net Flows = $15.7b, at 1HFY26, FUA Net Flows = $8.24b
- Run rate against FUA Net Flows and EBITDA margin guidance is looking positive and should be achievable

Discl: Held IRL 7.56%
SUMMARY
Robust quarterly performance - above trend quarterly growth in both the Net Inflows and FUA and FUM.
New capabilities continue to be deployed.
Positive member feedback from First Guardian compensation - the $101m expense/$71m NPAT hit will hurt, but this is one-off pain which allows NWL to retain its credibility, keep members and regulators happy, and to move on from the saga that much wiser from a governance standpoint - this will pass.
The underlying trajectory and momentum of the business is what is key to focus on and there does not appear to be any concerns on this front, at this stage. If only First Guardian did not happen ....!
NEW ACCOUNTS
Slightly below trend increase in new accounts of 4,841, up 2.9% QoQ, up 13.7% vs PCP

TOTAL FUA, TOTAL FUM
Nice above trend growth for (1) Comm New accounts (2) Total FUA (3) Total FUM - no concerns with these
Ratio of Managed Account FUM to Total FUA is 21.9%, up 1.5% vs pcp, up 0.6% QoQ - a good growing sign of recognition of NWL’s Managed Account capability.

FUNDS UNDER ADMINISTRATION
Inflows of $8.4b was a second consecutive quarter record - good sign of sustaining momentum
On trend Net FUA Inflows of $4.2b, the loss of $0.4b of 2 low-revenue generating institutional client accounts was flagged - does not appear concerning.
FUA net flows continued to benefit from ongoing flows from existing financial intermediaries as well as new accounts from new intermediaries.

3rd consecutive quarter of above trend growth in Custodial FUA.

FUNDS UNDER MANAGEMENT
Continued sharp growth from FUM net Inflows, $1.9b, a record.

End of period FUM was $31.4b, up 6.4% QoQ, up 30.6% vs PCP
Growth of FUM, underpinned by the growth of Managed Accounts, has steepened since the Mar 2025 quarter.

OTHER PROGRESS UPDATES
Looks like NWL successfully poached 5 experienced sales execs from other platform providers - must be material for it to be mentioned in the announcement.
Various improvements were deployed - Netwealth Private for the High Net Worth and Ultra High Net Worth segments, enhanced research tools, AI powered investment summaries, the Unify solution to expand integration capabilities.
A key offering “Individual HIN” is on track for go-live - it must be significant to warrant the commentary, but I do not quite understand why - need to poke into this a bit more.
The First Guardian compensation payments look to have had positive feedback, as you would expect.
OUTLOOK
If only First Guardian did not happen ...!

Discl: NWL Held IRL, HUB Not Held
CONTEXT
One of my to-do’s for NWL coming out of the reporting season was to do a quick high-level comparison with HUB24, NWL’s closest competitor. The objective of this exercise was to get a sense of where NWL was relative to HUB and confirm that staying invested in NWL continues to make sense.
Have kept the comparison at a superficial high-level based on info obtained from the ASX website + the FY reports from FY22 to FY25. While both are in the exact same FinTech Investment Platform space, they have different products, different metrics etc such that any attempt to compare at any lower level of detail than this is probably not going to provide any more insights.
Haven’t done a comparison like this before. Would really appreciate any feedback if the conclusions below are flawed ...
SUMMARY
- At roughly the same Funds Under Administration market share as at Mar 2025, it feels like NWL is significantly more efficient/productive/profitable than HUB
- HUB’s revenue is significantly higher than NWL and the gap appears to be widening
- BUT on Statutory NPAT and EBITDA (these being the 2 “directly comparable” profitability metrics), FCF Yield and Dividend Yield, NWL is clearly ahead of HUB, despite having much lower revenue
- So while NWL and HUB are running neck-to-neck in terms of current market share (HUB might be slightly ahead, I suspect) and running hard to increase market share, it does feel like HUB is some ways behind NWL in terms of generating shareholder returns
Based on this simplistic view, it gives me good confidence that staying invested in NWL is absolutely the right thing to do.
The sharp PE difference HUB PE = 108x, NWL PE = 64x, is what throws me out a bit. Given the above, I expected the HUB PE to be lower, not sharply higher than NWL, which perhaps could be a sign that the market is more confident of HUB emerging as the eventual top dog? Not sure if I am interpreting this correctly.
CHARTS


Discl: Held IRL
Nice 1QFY2026 update from NWL today.
- Positive momentum across all products & services sums up the quarter.
- First Guardian update is cautious - FY26 guidance now includes a caveat against unexpected First Guardian costs


The commentary in the update is littered with the usual “record-this-and-that” which I find quite confusing as it is mostly against the prior corresponding period 1QFY2025. As NWL expects to grow each quarter, referencing and gloating about the pcp comparison seems quite pointless other than to generate the buoyant headlines. While there is some seasonality, I prefer to focus on the underlying QoQ trend instead.
- Total Funds Under Administration hit $120.8b, increasing $8.0b QoQ, an above trend increase, building on momentum in the previous quarter - up 7.1% QoQ
- The Quarterly Increase in new accounts of 5,146, up 3.2% QoQ, reverted to trend following the sharp spike in the June 2025 Quarter - the accounts growth is now in short-term acceleration mode - very nice
- Total Funds Under Management was $29.5b, up 0.2% QoQ, driven by growth in (1) Managed Accounts, up 32.6% on pcp to $25.7b (2) Managed Funds, up 23.0% on pcp to $3.8b


FUNDS UNDER ADMINISTRATION
- Continued on-trend increase in Total FUA Net Flows of $4.0b, slight exceeding 1QFY25 and improving on 4QFY25
- Continuing to benefit from ongoing transitions from existing financial intermediaries as well as new accounts from new intermediaries
- Non-Custodial FUA hit $1.0b for the very first time - a pricing increase kicked in on 1 Oct 2025

FUNDS UNDER MANAGEMENT
Sharp uptick in FUM Net Flows of $1.8b, up 63.3% QoQ - a (noticeable!) record as it towers over previous quarters FUM Net Flows.

Just had a chance to review the NWL June 25 Trading Update released on 10 July.
SUMMARY
- A good business-as-usual update and positive commentary on FY26 - no immediate concerns
- Nice above trend QoQ growth on New Accounts - this sets it up nicely for FY26
- FUA and FUM both grew QoQ in line with the prevailing quarterly growth trajectory
- Should translate into a good full year FY25 result
Discl: Held IRL


Nice above-trend increase in Total Accounts and Quarterly Increase in accounts


Funds Under Administration
On-trend Q-on-Q increase in FUA Net inflows - management commentary that “FUA outflows were at slightly elevated levels due to partial withdrawals from larger accounts following increased market volatility. These outflows were primarily from non-fee paying FUA, and as such the financial impact was modest”.
Good positive FUA market movement.

Funds Under Management
FUM net flows of $1.1b for the quarter, 16% higher than pcp, moving back to the long-term FUM Net Flows trendline
FUM Growth was concentrated in Managed Account products - 34% higher than pcp, and accounting for 96% of all FUM net flows.


I am in the midst of (finally) taking stock of my NWL position. I blindly followed MF Pro’s direction to open the position back in 2018, understood the thesis, sort of understood what it was about, but never deep dived until now. It is now my 2nd largest IRL position at 10%+ and 2nd largest winner - living proof that the coffee can investment approach does work, particularly if the company was picked by the great MF Pro combo of Joe & Matt.
After deep diving the financials, I struggled to clearly understand the products. So I signed up for a product demo last week through the NWL website to better understand the Personal Investor products, as I did also want to explore what was available (and at what cost) vs my current eSuperfund SMSF setup. Here are my notes, of both the SMSF-related products, as well as my takeaways from a “better understand NWL” perspective. A lot of the points should be intuitive, but having the conversation and the ability to ask questions made a huge difference to the understanding.
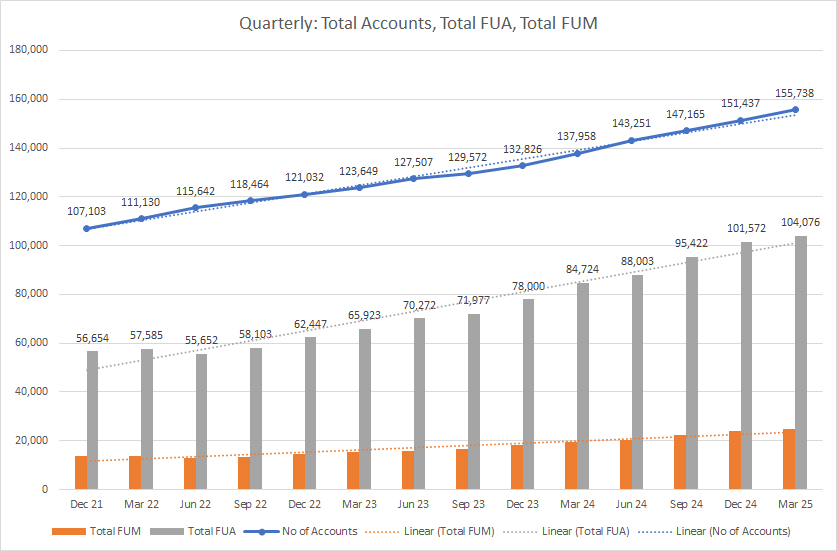
What I understood, the chart of the key NWL platform metrics at the end of this post and what I thought was an excellent article by A Rich Life’s Patrick Poke sums up why the MF Pro pick of NWL was an outstanding one and why I should absolutely stay invested with a high portfolio allocation.
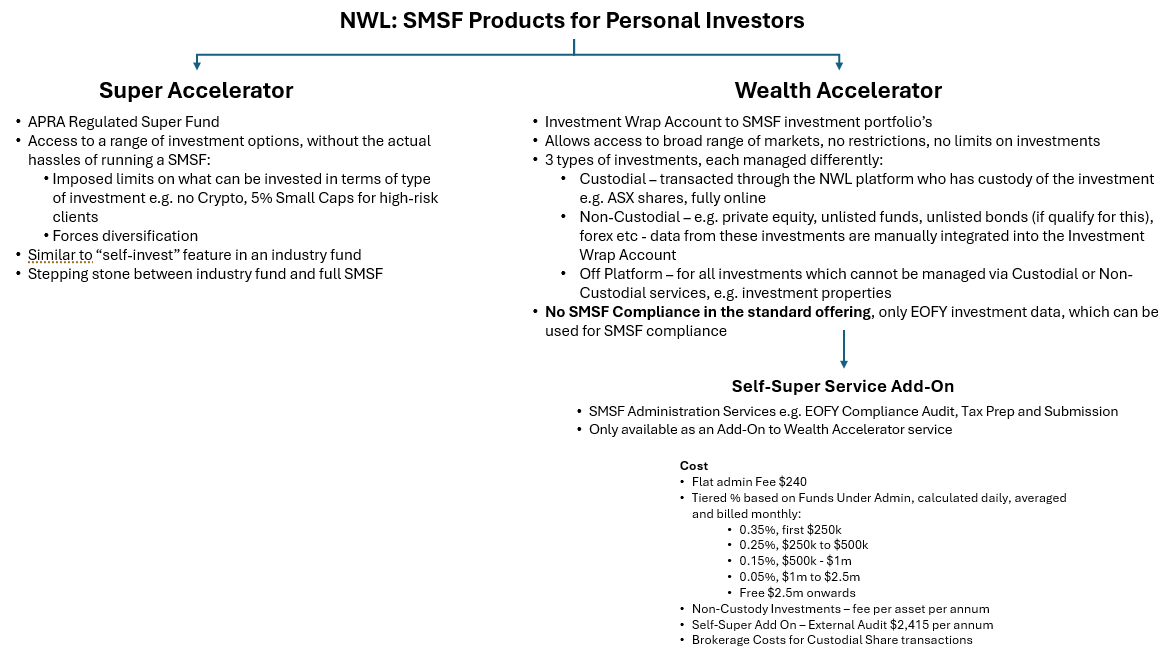
OVERVIEW OF THE PERSONAL INVESTOR PRODUCTS
THE SALES ENGAGEMENT PROCESS
- The Sales Team response’s to website enquiries - appears to be within 3 business days, which is comforting
- The Sales rep spent 45 mins talking me through the products, pricing and despite my hesitation in product suitability, continued to offer a demo - this desire to take me through the product was good - if I was not clear on what I am after, the demo would have got me
FINANCIAL ADVISOR FOCUS
- 96-97% of NWL customers operate through Financial Advisors
- Each financial advisor has its own “platform” within the NWL platform:
- Tailored functionality
- Tailored screens, reports
- Each client of the advisor has their own login to the Advisors “platform”
FEE/COST STRUCTURE
The explanation of the cost structure and the mechanism in which it is calculated (daily snapshot, averaged then x days in month) helped bring to life how the Funds Under Administration Market Movement metric, what broadly makes up the various NWL revenue lines - Administration Fees, Ancillary Feels, Transaction Fees, Management Fees, and how both these numbers will rise and fall based on how the market moves.
It also provides clues as to where and why NWL still requires a reasonable labour force.
WHAT ATTRACTS NEW CLIENTS INTO NWL
The Sales Rep commented that what attracts new clients into NWL:
- Financial Advisors - once a Financial Advisor comes onboard, their clients come onboard as well
- Detailed real-time and EOFY investment reports from the platform is a key attraction for SMSF customers who focus on the investing side rather than SMSF Administration
- Clients who want access to a range of investment options that they self-manage, without the hassles of running the SMSF administration (Super Accelerator)
HOW DOES IT COMPARE WITH ESUPERFUND
It will cost me at least 3x the eSuperfund annual fee to get:
- base Wealth Accelerator
- the “equivalent” SMSF compliance service that eSuperfund provides
- Significantly better investment information/data/performance/dashboards to manage the SMSF’s investment
- Cost will vary based on the daily balance of the Fund
- Cost will also rise further if the SMSF has off-platform or non-custodial assets
A non-starter if you are able/willing to invest time in managing the SMSF admin on a day-to-day basis.
NWL PLATFORM GROWTH SINCE FY2021
Discl: Held IRL