Note: I am trading Nuix as chart is fantastic and can't complain about 26% share price rise
However ...
Market cap of Nuix is $1.4b. Yes. Billion. Great turnaround from the last few years BUT lets look at FY24 numbers
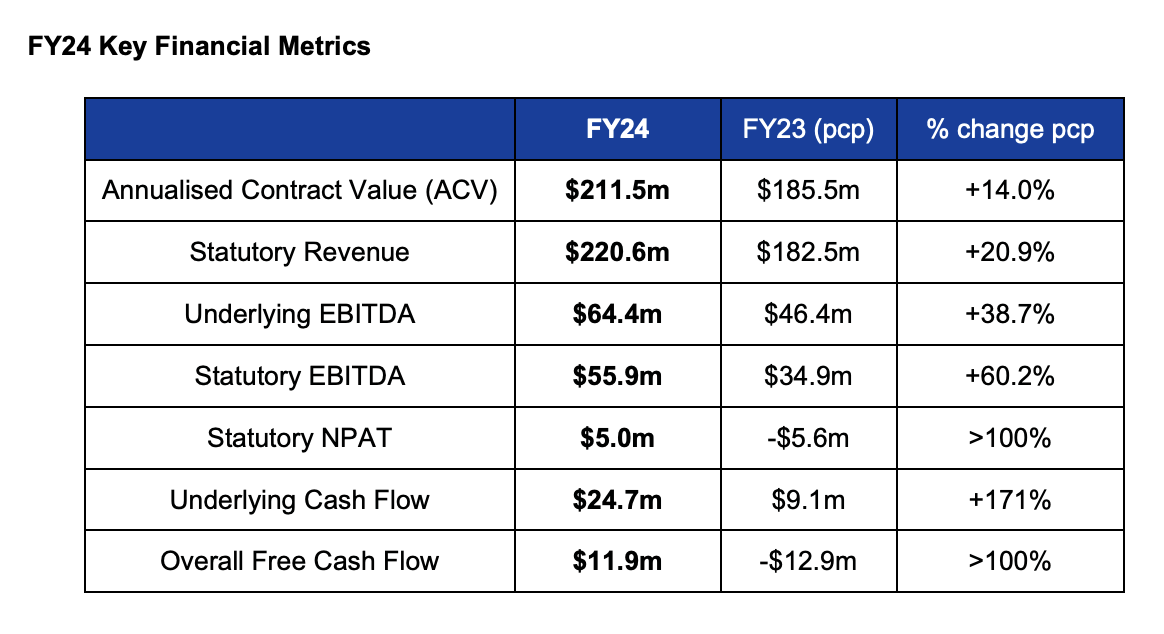
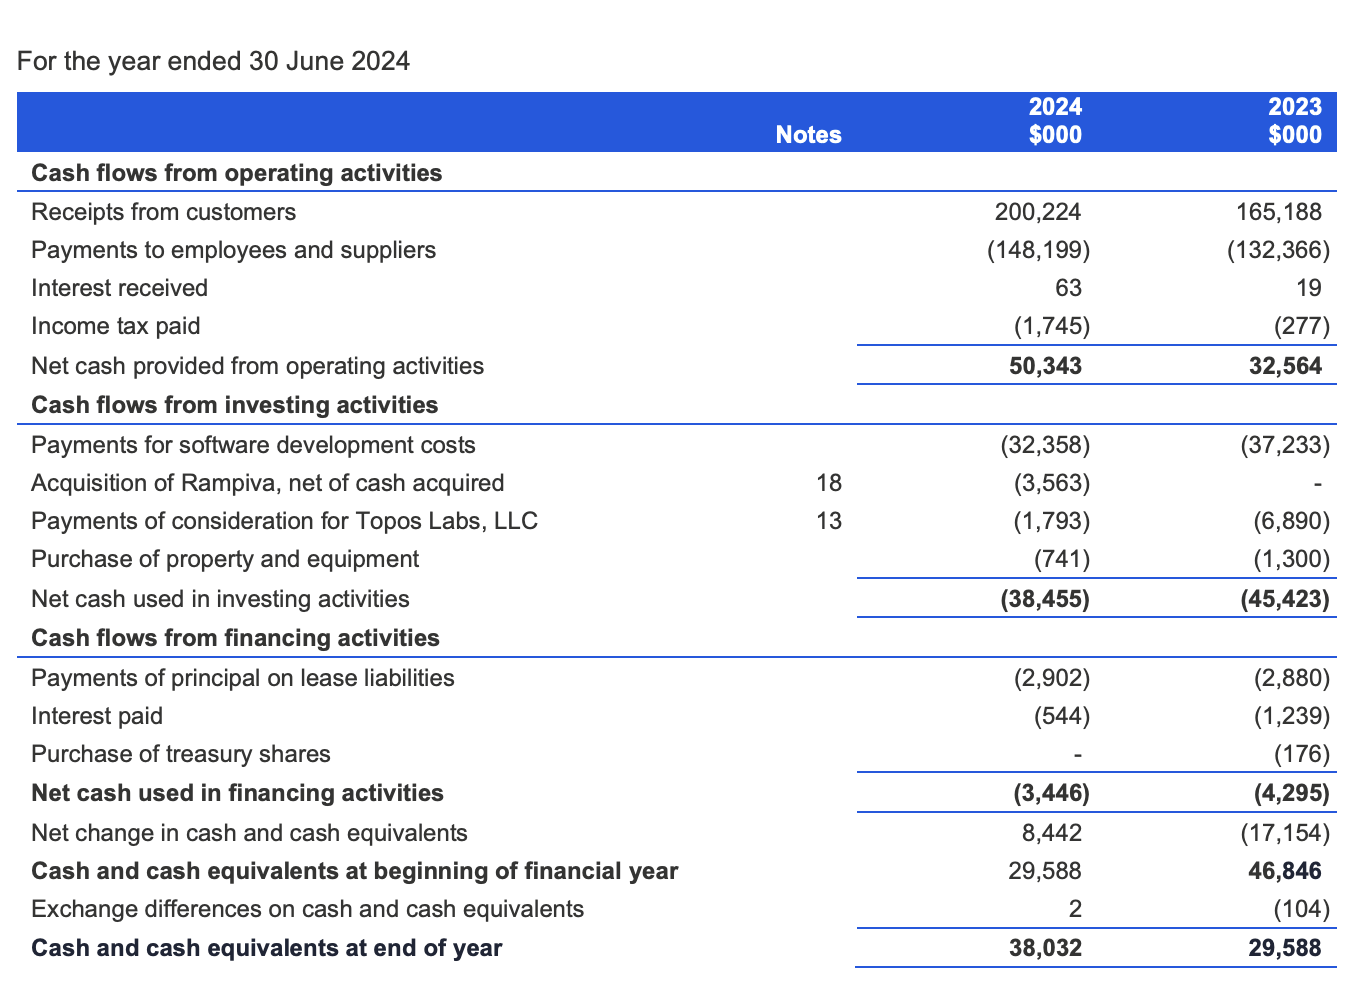
I have included a financial metrics table AND their cash flow statement. I tend to ignore EBITDA because Nuix capitalises a fair bit of their R&D.
Splendid growth. Positive NPAT and Cash flow. Churn decreased to 4.4% and net dollar retention increased to 112.9%. Reported underlying free cash of $24.7m. Erring to conservatism, I calculated their free cash flow to be more like $15m.
So I get a free cash flow yield of 1.1% or company is trading abut 90 times free cash flow. Expensive right?
I do expect if this positive momentum continues that Nuix will release stunning increases in NPAT for FY25 ... like 400% or even more


