Consensus community valuation
Started to take stock of Block today following last week’s release of its 2QFY2025 results. Have held since converting from APT shares in Jan 2022 but it has been a coffee can holding and have spent no time on monitoring progress. The APT conversion was almost the super-peak of XYZ, have been underwater since the conversion, and on hindsight, was not a good entry point at all, but the current trajectory looks very promising indeed.
The following 4 quarterly charts from FY2023 tell the high-level story at a glance. Will need to have a good read of the 10-Q report to get into a bit of the weeds, but these basic charts gave a good feeling of where things are heading.
The initial overwhelming feeling is that it feels like operating leverage is kicking in nicely.
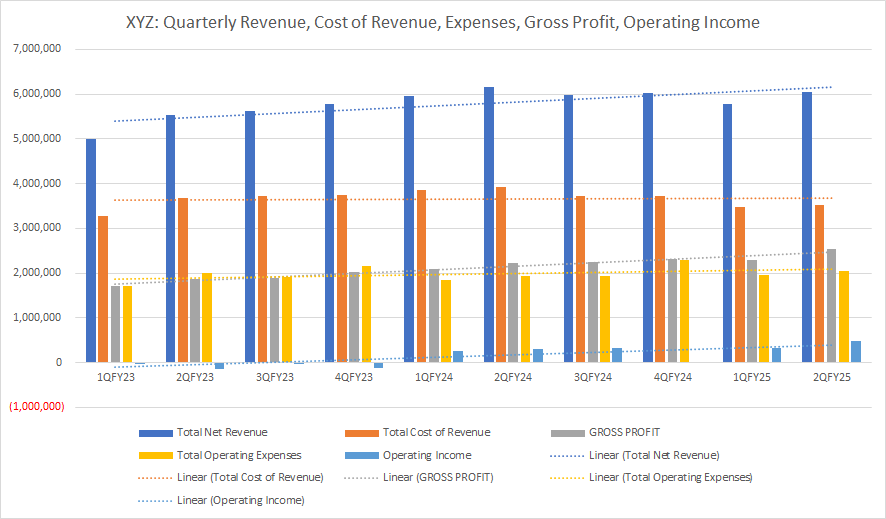
- Revenue - growing nicely
- Cost of Revenue - flattish
- Gross Profit - growing nicely as revenue grows against flat cost of revenue
- Operating Expenses - also flattish
- Operating Income - growing
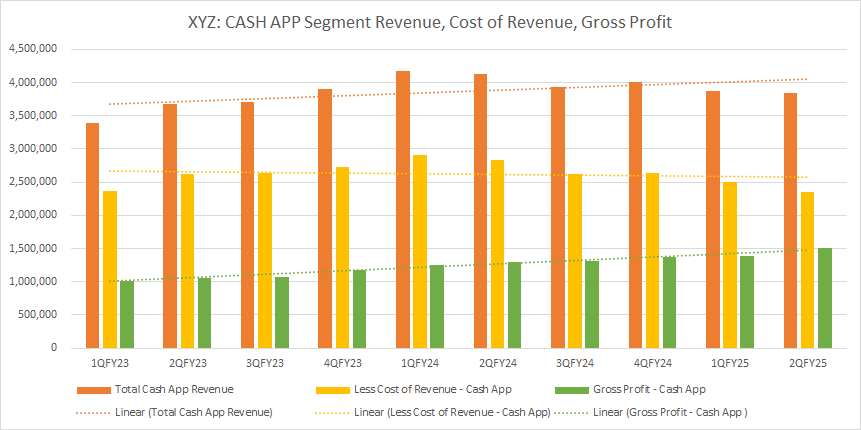
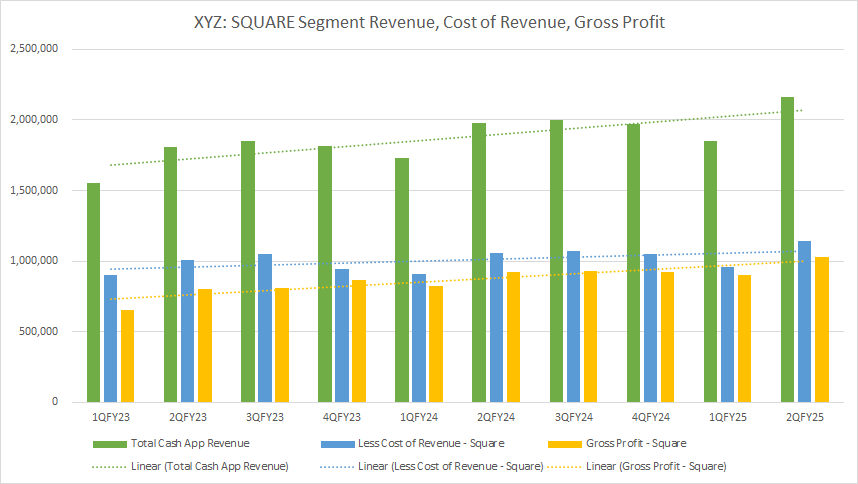
Same clear trajectory in the 2 XYZ Segments, Cash App and Square:
- Revenue - growing
- Cost of Revenue - declining for Cash App, marginally rising for Square
- Gross Profit - rising for both segments
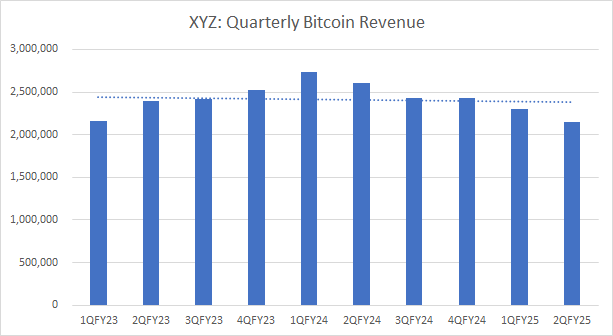
This may well be my proxy to gaining exposure to BTC .... revenue trend is flat to down-ish
Discl: Held IRL
Extract from motley fool:
Q2 guidance beat
Block share price jumps on results day
- Gross profit up 14% to US$2.54 billion
- Operating income up 58% to US$484 million
- Adjusted earnings per share up 31.9% to 62 US cents.
What happened during the quarter?
For the three months ended 30 June, Block was on form and reported a 14% increase in gross profit to US$2.54 billion. This was ahead of its guidance and driven by a 16% jump in cash app gross profit to US$1.5 billion and an 11% lift in Square gross profit to US$1.03 billion
Management notes that it outperformed its gross profit guidance thanks partly to the launch of new products across Square and Cash App to sustain strong growth at scale.
It also highlights that it drove year-over-year improvement across all key profitability measures and outperformed its profitability guidance in the second quarter of 2025. Operating income was US$484 million while adjusted operating income was US$550 million.
XYZ Friday at close of trade:

Return (inc div) 1yr: 45.01% 3yr: 2.42% pa 5yr: N/A

Disc: RL
"The Path to 2024 Earnings Recovery " Webinar = Westpac with parteners Sandstone

SQ2, 52 week low, any future here?

More from Sandstone: Sandstone Insights ( 15 day free trial)
Block release shareholder letter and results this morning - Lots of news to go through.
$1.18 Billion in gross profit for the Q4
Up 38% at time of writing.
DIsc - Held
