


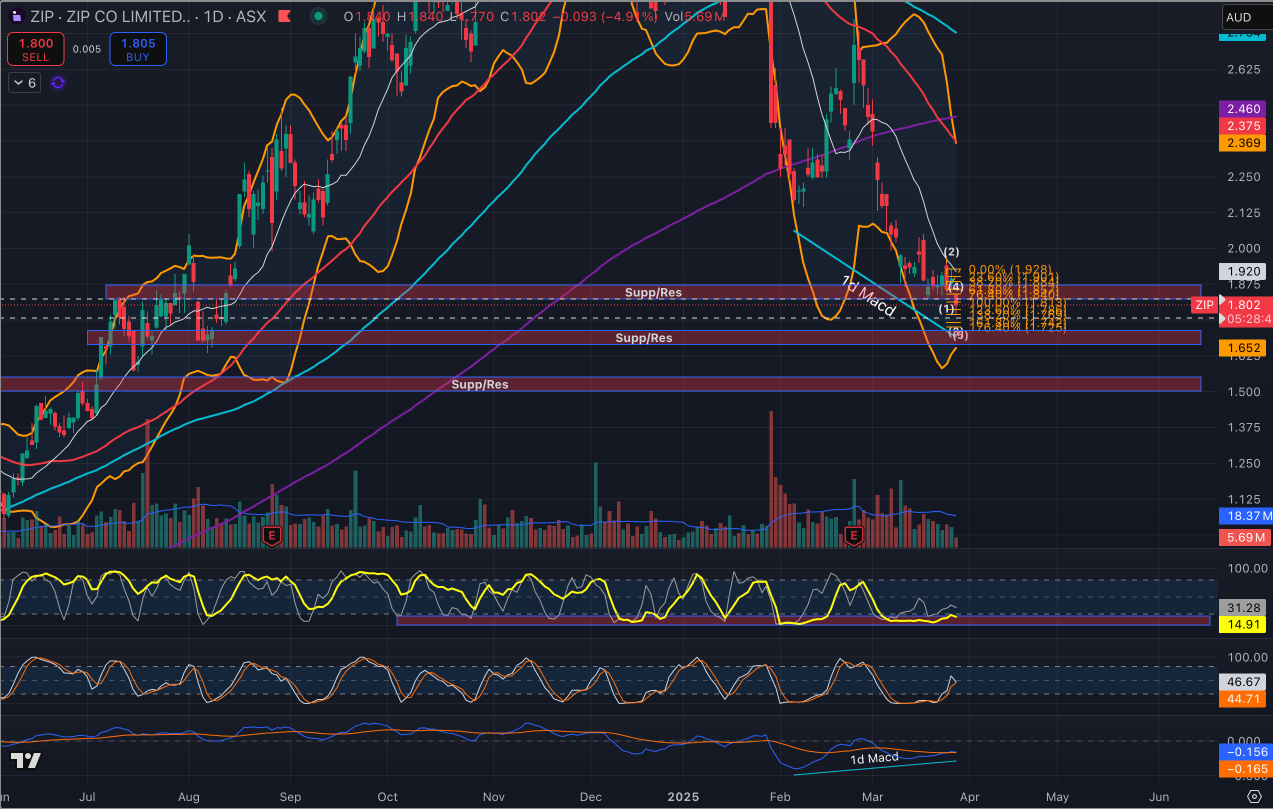
The positive divergence on the 1Day MACD is still in play and is quiet a strong one. The $ would have to drop substantially to take it out. Im watching and counting its waves as it declines. Of course I will wait as alway for the 1st waves 1 & 2 up before I make any decisions
In the short term im following the 1hr chart below.
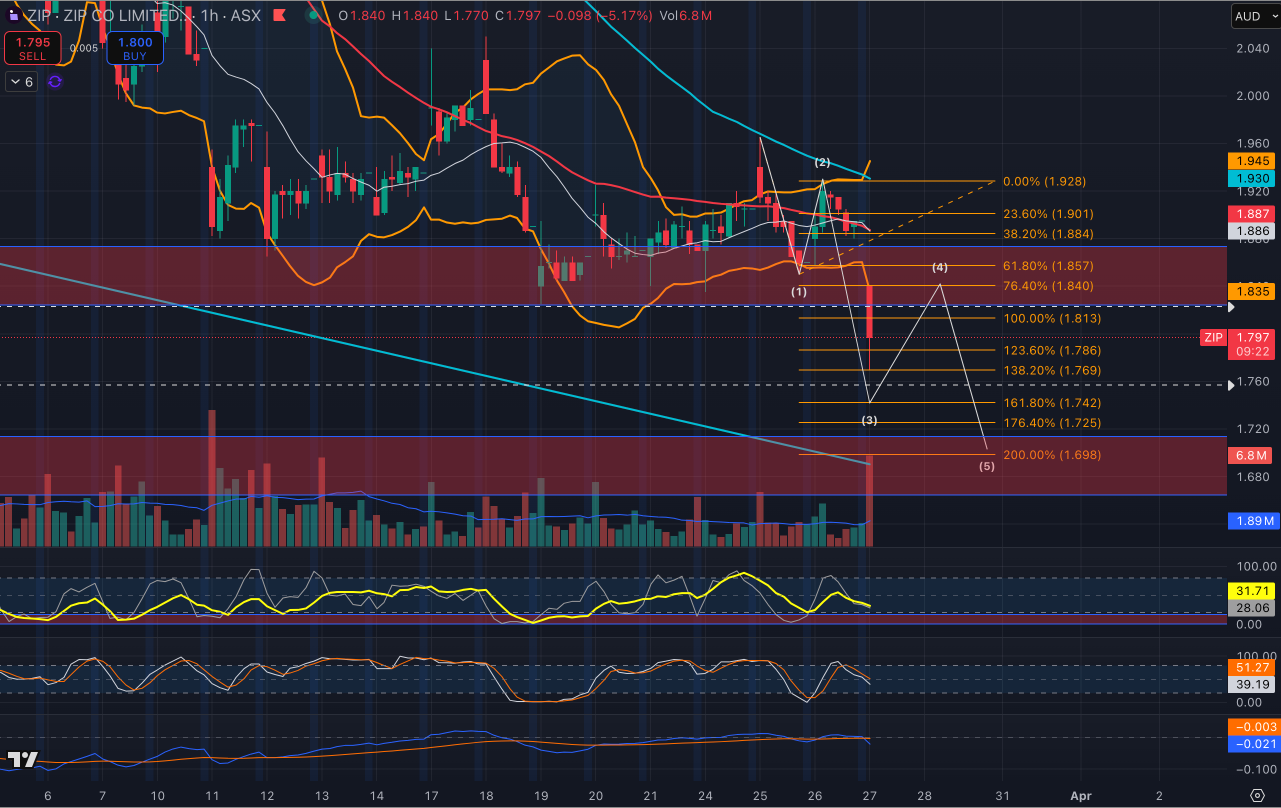
The 3d & 1w charts are on the bottom of their respective Stochastic Indicators and notice on the larger times frames below that their is a good deal of support all around the 1.68 region. You have 1) Blue historical trend line 2) Pink horizontal $ support line 3) look above to the 1hr chart to see where wave 5 of the current C wave just so happens to end 4) all the Stochastic Indicators on the bottom 5) a great big 1d MACD divergence. The more un-correlated indicators that give a signal, the stronger the conviction I have for the turn around being immanent.

I have been working Zip for some time now and believe we will be seeing the bottom of W4 retrace ending soon if not today before the final W5 up. Of course I will be wait for the 1st waves 1&2 up before entering
