Over the long run, the main driver of share price is earnings per share (EPS). If, for example, EPS has grown at 10% annually over a decade, you can be reasonably confident that the share price will show a similar appreciation.
Consider REA Group (ASX:REA), whose per share earnings compounded at an average annual rate of 27% between 2004 and 2023 (yes, it’s been that good. That’s what happens when you successfully disrupt a massive industry, i.e. print classifieds).
Over that period the share price has gone from 96c to $137 (using the price as of June 30 each year), for an average annual compound growth rate of 29%.
Not exactly the same as the earnings growth, but pretty darn close!
Of course, year to year there is little correlation.
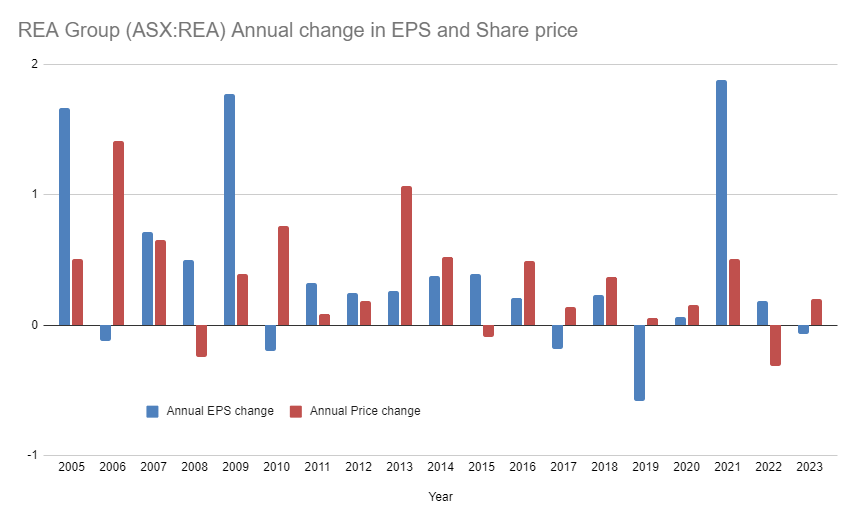
As can be seen with REA Group, share price and earnings growth can be quite different in any given year — sometimes even moving in opposite directions.
The missing piece of the equation is the humble P/E ratio, which combines EPS and Share price. Rearranged it looks like this:
Share price = PE x EPS
In other words, share prices are a function of profit and market expectations.
And what you tend to notice is that changes to the annual PE can really obscure what is happening under the hood. This is what Ben Graham was talking about when he said that “In the short run, the market is a voting machine but in the long run, it is a weighing machine.”
We can combine the annual change in the PE and EPS to show how the two forces acted on the share price of REA Group each year:
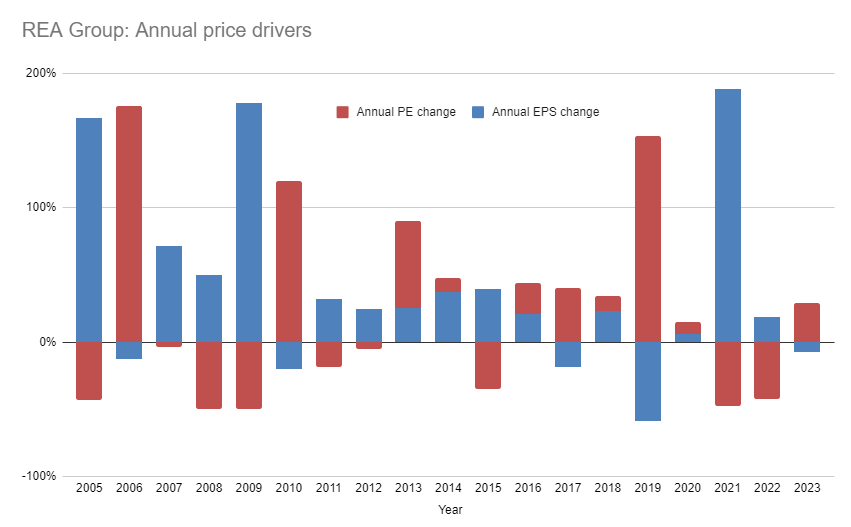
The net difference between the red and blue bars gives you the annual change in share price.
So what?
Well, as investors we obviously want the price to go up. And improving sentiment can do wonders on this front…at least for a while. But, eventually, the business needs to deliver on said expectations. If it doesn’t, and expectations fall away, a drop in the share price is inevitable.
You see a lot of this in the share market. And it’s important regardless of whether you’re a value or growth investor; both need to see a rate of growth in earnings that justifies a given PE..
Moreover, the very best gains are achieved when you see that wonderful combination of increasing earnings AND multiple expansion. You can guess from the chart above which years really blew the socks off for REA Group shareholders.
For that to occur you need to find a company on the verge of a strong uplift in earnings, but where the market hasn’t yet cottoned on to that. And how do you do that? Well, by turning over a lot of rocks and not being afraid to go against the general view of the market.
Easier said than done, but there it is. And it’s why small caps hold such promise — they tend to have more room to grow and are far less scrutinised.
Of course, none of this is news to our savvy community of investors. But it’s kinda cool to see it on a chart.
Strawman is Australia’s premier online investment club.
Members share research & recommendations on ASX-listed stocks by managing Virtual Portfolios and building Company Reports. By ranking content according to performance and community endorsement, Strawman provides accountable and peer-reviewed investment insights.
Disclaimer– Strawman is not a broker and you cannot purchase shares through the platform. All trades on Strawman use play money and are intended only as a tool to gain experience and have fun. No content on Strawman should be considered an inducement to to buy or sell real world financial securities, and you should seek professional advice before making any investment decisions.
© 2024 Strawman Pty Ltd. All rights reserved.
| Privacy Policy | Terms of Service |
ACN: 610 908 211