


Just wanted to update my previous model based on the most recent 4C data to confirm what at first glance looked ugly.
Despite the confusing change in metrics I have come up with the following, could be right or wrong..
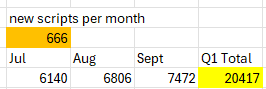
From the 4C, There were 20417 total units shipped in Q1,
** only thing that may skew this is August potentially was low due to the holidays or whatever goes on over there, the pharma data on HC seemed to support this from the bloomberg terminal or where ever it comes from, this is possibly what got it pumped down to 10c recently.
** In the below table:
-- Yellow, total units shipped,
-- July units = historical June units (which they gave previously of 5474 or thereabouts) + X
-- August = July + X
-- Sept = Aug + X
Goal seek X for when Q1 Total = 20417: 666 net additions per month.
Previous posts I was thinking that 1000 / month would be a good base with increased sales force / prescriber productivity etc but missed this by 40% and also the GTN is in the shocker.
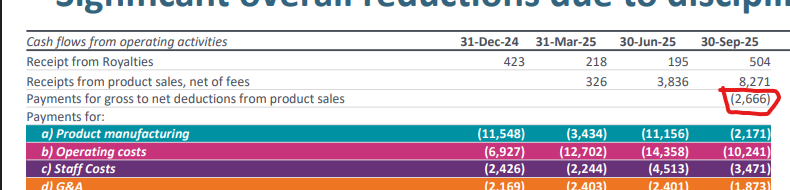
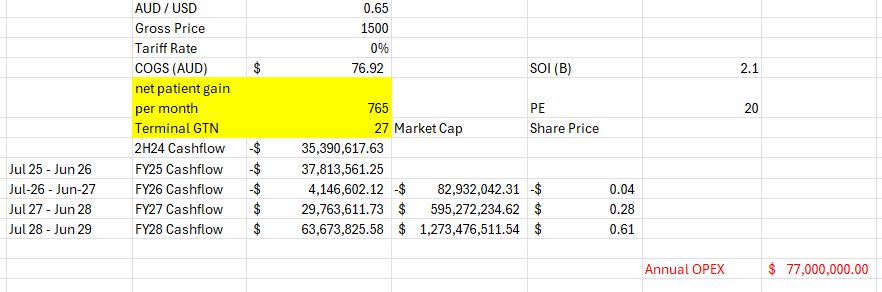
Also this little expense line has been fleshed out of somewhere, not sure what it fell under previously but makes the net revenue $5.6m?
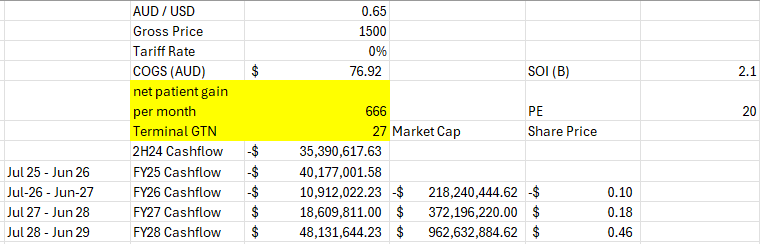
anyway, based on the old model with updated numbers...
COGS I possibly have low at 77 / unit AUD but who knows with what they are reporting.
no COGS until Jan 2026.
-40m loss this FY probably more if winter and high deductible season hit hard.
-11m loss the following year
maybe an 18m profit the year after before tax.
I guess there is a chance the new reps get some growth firing but that net patient gain I have deduced from the numbers provided is ugly to me as is the GTN. my theory about the GTN and PA units must have been incorrect.
Hard to figure it out when they have taken away the script breakdown between free, reimbursed, PA etc.
again that was the only red flag I needed this morning to unload what I had left, they changed the metrics because if it actually is 666 per month average net patient gain of the quarter it stinks more than the tales of $400-450 USD Net / unit.
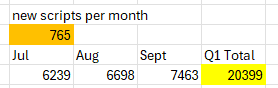
As a side note, suppose August was a shitter of a month due to holidays etc
If I set August in the previous table to be 60% of the scrips added in July and then goal seek for scripts / month, brings the average up to 765 but with a pretty average August.
Still makes for ugly reading considering where it was hoped to be going.
hope it makes sense, can't see too many positives after having looked a bit deeper.
Maybe my OPEX is a bit high, but the COGS is murky at best to me
Maybe my GTN at 27% is a bit low, but its really flattening out month by month
As always any comments welcome hope this may be of use to anyone still holding and on the fence, to me there are much better options out there than to wait and see if they can do it because the performance so far has been underwhelming.
Have had some time to analyse the presentation and come up with the best way to monitor upcoming progress,
I feel The simplest metric to track is the net increase in users per month after the churn along with the gross to net. This was reported as the Tx / month.
Short version, it probably still isn't as bad as it looked and has been sold down heavily, won't be a 6 month success story but even on the lower end case things will be ok in 12-18 months time and they could be close to a profit, main takeaway is cash on hand after the raise and factoring in the debt facility a raise shouldnt be needed.
Welcome anyone's thoughts/comments on this.

As noted in a separate post, when you remove the free units and factor in the PA units that get retrospective approval it isn't as bad as it looks. The high deductible dip in the given example didn't seem to be as bad in the year after the launch but that remains to be seen, I have put a dip in year 1 post launch but not year 2.

Another thing to note is the adherance rates, it was 79% overall and 95% for people in the auto refills,

The 79% adherance rate on the surface looks low but it is most likely related to the free units being shipped each month (mid 20%, assuming these aren't eligible for refills and these account for most of the discontinuing users.
If this assessment is correct, the actual adherence rate is still quite reasonable.
All this being said below are 3 cases to consider, both with an example for GTN of 30 and 35.
All have annual opex of 80m to allow for the extra reps, COGS as noted below, and the bodor royalty is 5% of net sales.
*need to confirm the opex in the quarterly, might still be hard to tell with the foray into digital that didn't go well but should be a good indicator at least.
Case 1:
Maintain the net addition of 1150 users on average per month as has been the case so far, GTN tracks to 33%, with a dip being overserved in high deductible season.
Not sure if the bigger table will be readable, but COH bottoms out at 70m, with a cashflow positive month in June 2026.


Case 1b:
GTN peaks at 30 with 1150 / month

Case 2:
Net Addition of users gets up to 1500 / month with the addition of more sales reps and an S curve effect with prescribers becoming more productive.
Cashflow positive August 2026, COH bottoms at 60mil.

Case 2b: GTN peaks at 30 with 1500 / month

Case 3:
Growth underwhelms and has peaked at 1150, continues to add at 750 / month with additional reps.

Case 3b: GTN peaks at 30 with 750 / month

Following on from the Cap raise and launch data released below is some Analysis of the path to $200mUSD Annual Revenue,
- Week on Week patient number growth is going at approx 13%, only a small data set
- New prescribers growing well forming a strong base, quick google search shows it looks safe to assume there are at least 10,000 dermatologists active in the US so there should be decent growth in individual prescribers to come.
- Addition of 20% extra sales staff to drive dermatologist adoption.


There is still a pretty wide window for where this can land, the questions to try and answer are:
- How long can they sustain WoW patient growth? This is currrently 2,280 new patients per month as of the 1st week of April.
- Assuming no Bolas affect here and continuing at a WoW growth of 10% (have averaged 13% for the first 9 weeks of launch) it looks pretty safe to assume before the EoFY we could be tracking at new patients per week of 1000 or equivalent to 4,380 / month. If the new sales staff increase uptake this could happen a bit quicker. (10% WoW growth would have this happening end of May)
Weekly New patients acquired:

- If we were to get to this rate of approx 4,300 new patients per month running for 12 months through the next FY with patients already acquired or expected to in this FY this would land at $200m USD revenue for the coming FY.
- This is not factoring in any benefit from the digital campaign and assuming no further growth in user acquisitions per month once we reach that 4300 / month mark.
- Refills are noted as 100% but this most likely will reduce down as we have discussed previously but it sounds like the onus is on the user to cancel rather than to keep them coming. Also a note from the webinar, when the patient is coming up to the end of the 12month mark, SendRX contact the prescribing dermatologist to reming them to arrange for another appointment and renew the scripts, It wasn't mentioned in the webinar but I suppose they could possibly be directed to the telehealth avenue at this point as well.
The target market from the slides was noted to be 3,700,000 patients that have already sought help from a Dermatologist.

- 61,800 concurrent users would give 1.7% market penetration
- As a side note if that level of users was hit from end of next FY, the forward looking revenue assuming no churn issues and not factoring additonal users would be tracking for $333m USD
Table below shows monthly users acquired and cumulative monthly users --> sales.
New users capped at 4380 to factor in any churn and to assume a safe peak monthly acquisition rate.

The Wildcards:
- Acquiring any % of the 6.3m people with HH that have not sought help through a dermatologist
- any small% of these users is a huge benefit to the revenue stream and not accounted for in the figures above.
- Off-label prescription
- Qbrexza has some talk online about have being prescribed off label, hands, feet, groin, head, any off label prescriptions for Sofdra are a benefit that hasn't been factored into the forecast sales, the mechanism is largely the same and some affect should be seen in these areas. There was a question in the Cap raise webinar about if this could potentially be suitable for menopausal women experiencing sweating issues.
$200m USD annual revenue would be inline with the FY2028 forecast from Euroz below and would imply 143m AUD profit. 143, with 1,950m SOI --> 7.3C EPS. pick a PE for final SP.
The Euroz 2029 Operating income of $134m USD --> 206.7m AUD would be approx 10.6c EPS to follow conservatively the year after on similar growth rates the FY2030 or 2031 could be achievable.
Still a wide range for where this can land sales wise but extrapolating out the early numbers and plotting out what looks to be conservative monthly customer acquisitions I will be watching this closely and updating the numbers and trajectory as the data keeps coming. Very encouraged by the early data and to see what the digital channel does once fully activated.
Any input welcome as always, still a shame the launch slipped a few months but good to see it is finally happening with positive signs.

Disc: Held IRL and SM
Might be cleaner in a new straw rather than the cap raise one.
Interesting, especially with the digital not really turned on.
If they can add 100 people per month (seems doable based on the small data sample) and with that data so far being derms only.
On track for rolling annual revenue of $200mUSD by June, at the current run rate $129m USD earnings for FY25/26.
Interesting to see how much this $40 raise can amplify sales when they fine tune the platform.
Didn't pick up anything that turned me off in the webinar, looks like an experience team doing what needs to be done
Although I am still shitty the launch timing was slow and interesting to hear the digital hasn't really started even though it was in for start of March. Or did I not hear that correctly.

Hi Everyone,
For the sofdra launch and upcoming half year report from Botanix, I have done some conversions on the Kaken ecclock sales data to try and get an idea of if we launched on par with the Kaken ecclock launch what sort of revenue we might be looking at as a base case.
Unit sales estimate from Euroz table.

kaken 3Q report, target for annual 2,200m Yen this FY

Potential Sofdra sales using Ecclock unit sales adjusted for US population (to factor in some people not being insured I have used a factor of 2 for US pop : Japan Pop when in reality it is 2.6x
Estimating that of the total units of ecclock sold on average there were 2 scripts per individual. Botanix presentations suggest that it is on average a bit less than 2 scripts per individual.
I have worked off an average of 6 repeats per US user and the usual $450 / person and 0.65c AUD - USD.
With the sales team in place I would be hoping for a better launch and more traction than Japan had so thinking these numbers are possibly on the conservative side.

I am thinking this might be close to a base case for the launch considering we have *hopefully* a better sales force, more experience management and the platform factor as well.
Interested to hear everyone's thoughts on this as a base case, possibly reads as a bull case when you look at the numbers though.
Disc held IRL & SM