


Healthcare tech provider and Strawman Community favourite $AHC posted their 1H FY26 yesterday. I've been watching this one ever since it was put on my radarscreen by several of the most illustrious StrawPeople, and have in recent weeks opened an initial position following its fall below my "buy" price of $0.35. (RL 4%, although I'm yet to add on SM).
As this is my first coverage of $AHC, my reason for lurking for so long is that I wanted to get a better feeling for how it's M&A strategy is playing out, as I tend to be reluctant when firm's use M&A because i) it muddies the waters of the historical numbers, so I can't see the underlying "economic engine" and ii) well, because I don't like M&A unless I get confident that management know what they are doing. Other than that $AHC is in my sweetspot, combining healthcare and tech, and so I've taken an initial bite.
@MangroveJack has already given the headlines, however, because the impressive headline result includes organic and inorganic contributions, I've decided to have a go at pulling things apart in some future detail.
In a break from my usual structure, I drop 3 charts - to give a sense of half-on-half variations and overall trends. Then I'll record my analysis.
My valuation will follow in a few days, however, from my work so far, its looking broadly in line with @Hogajo ($0.45) and @Wini ($0.50) at my p50%, although my range is a bit wider.
As I said, while I have been following this one for a few years, this is my first write up, so I'm very keen for any feedback from those StrawPeople who have a better understanding of this microcap.
Summary
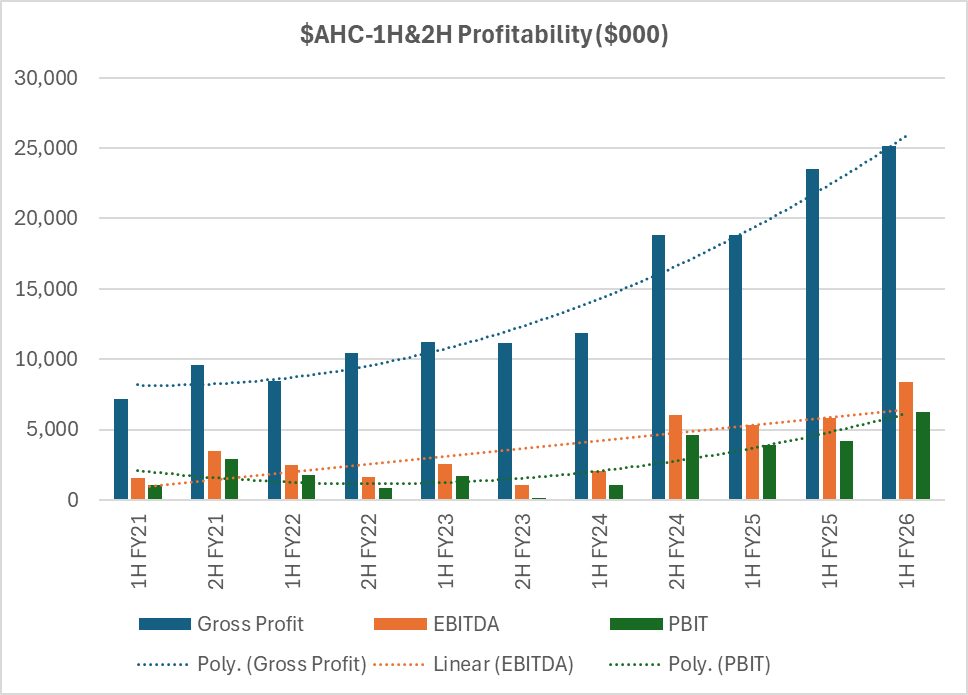
Austco Healthcare delivered a record performance in 1H FY26, combining acquisitions and organic growth to drive revenue up 30.7% to $48.2 million and net profit after tax up 61.7% to $4.7 million.
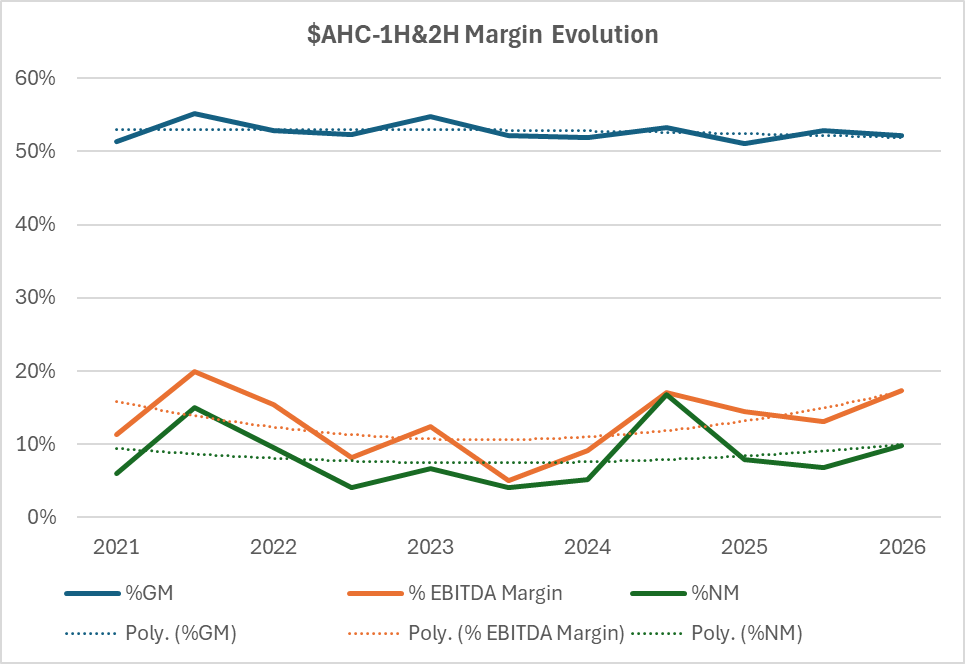
The company look like it might be demonstrating some operating leverage, expanding EBITDA margins to 17.1% while holding %GM within the range of the last few years.
The result gives an initial positive indication of its strategy to vertically integrate ANZ reseller businesses without diluting profitability.
With a debt-free balance sheet holding $15.2 million in cash and a substantial order backlog of $47.2 million, Austco has solidified its financial position while maintaining strong visibility on future earnings.
As fas as I can discern, acquisitions are currently the primary engine of this growth, and it will be important to see what the organic "engine" looks like from here over the coming periods.
Today's result seems to reduce my view of the risk that low-margin installation revenue would dilute Group quality; instead, Austco seems to be capture more of the value chain margin.
With the UCR flattening, future growth will likely require either new M&A targets in other regions (North America/Europe) or a re-acceleration of pure organic software sales to drive the next leg of expansion. Personally, I hope we get to see some of the latter first, although, the results are encouraging, indicating that management are adept at identifying the right acquisitions, keeping them appropriately sized and then executing well.
My Detailed Assessment
1. Revenue Growth: Inorganic Drivers dominate
Revenue rose 30.7% to $48.2 million.
This follows a 40% jump in FY25 full-year revenue. The growth trajectory remains steep, but the composition has shifted.
Organic vs. Inorganic: While the company cites "continued organic growth," particularly in North America, the primary driver appears to be the full-period contribution of recent acquisitions (Teknocorp, Amentco, and G&S Technologies).
- ANZ Revenue: Surged 57% to $26.9 million. This disproportionate growth in a mature market confirms the impact of rolling up resellers (G&S, Teknocorp).
- North America: Grew 38% to $15.4 million, which is likely the strongest source of pure organic growth, given fewer recent acquisitions in that specific region compared to ANZ. (I see this as a big positive)
- Asia: Revenue declined to $3.9 million, highlighting project lumpiness in organic markets without M&A support.
2. Margins and Operating Leverage: The Key Success Story
The most critical positive in this result is the expansion of margins despite the integration of typically lower-margin reseller businesses.
- Gross Margin: Improved to 52.2% (up from 51.1% in 1H25). This defies the historical expectation that acquiring hardware resellers (who earn lower margins than the OEM) would dilute Group margins. It suggests Austco is successfully capturing the full vertical margin (manufacturing + reseller markup) or realizing manufacturing efficiencies.
- EBITDA Margin: Expanded significantly to 17.1% (up 310bps from 14.0% in 1H25).
- Leverage: Overhead expenses grew 23.6%, lagging well behind the 30.7% revenue growth. This confirms that the fixed cost base (R&D, corporate) is being efficiently spread over a larger revenue base, a classic indicator of successful scaling.
3. Earnings Quality and Cash Flow
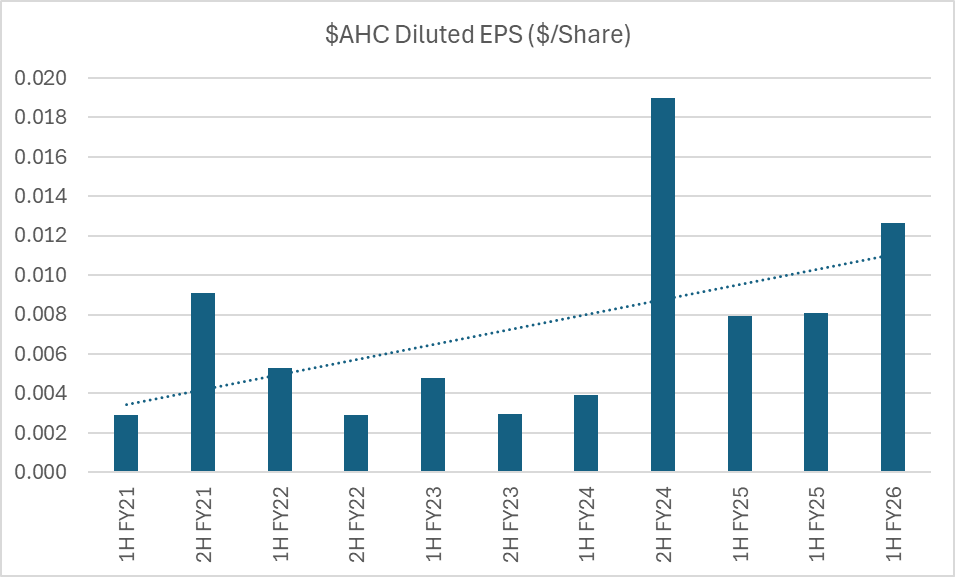
- NPAT: Up 61.7% to $4.7 million. The effective tax rate has normalized to ~24.5%, making this a "clean" profit number compared to FY24 which was boosted by one-off tax assets.
- Cash Flow: Operating cash flow of $9.2million was strong, effectively matching EBITDA ($8.3m). This indicates high earnings quality; profits are converting to cash rather than getting stuck in working capital (receivables/inventory).
- Capital Allocation: The company remains debt-free with $15.2 million in cash. However, organic investment is relatively modest (Capex $0.5m), with the bulk of free cashflow ($6.0m) directed toward acquisition payments (earn-outs).
4. Forward Visibility
Unfilled Contracted Revenue (UCR): Stood at $47.2million. While substantial, this has essentially plateaued since August 2024 ($50.3 million) and June 2025 ($53.8 million). A flat or slightly declining UCR in a high-growth environment suggests that while the company is executing delivery (converting order book to revenue) efficiently, the rate of new organic wins may be stabilizing rather than accelerating. The order book is being consumed as fast as it is being replenished. This is something that will be important to monitor over the next coupld of 6-month periods.
Overall, a nice result. And although the market agreed with the SP up 18+% today, this movement has to be considered in the context of the pullback over the last 3-4 months.
Disc: Held (RL 4%)