I've been wondering about opportunities with retailers during tough financial times. I thought it might be useful to look at what a high quality retailer like Nick Scali went through when this happened in 2008. (I currently own on SM, but wondering what type of opportunity might present itself in the future in the right conditions).
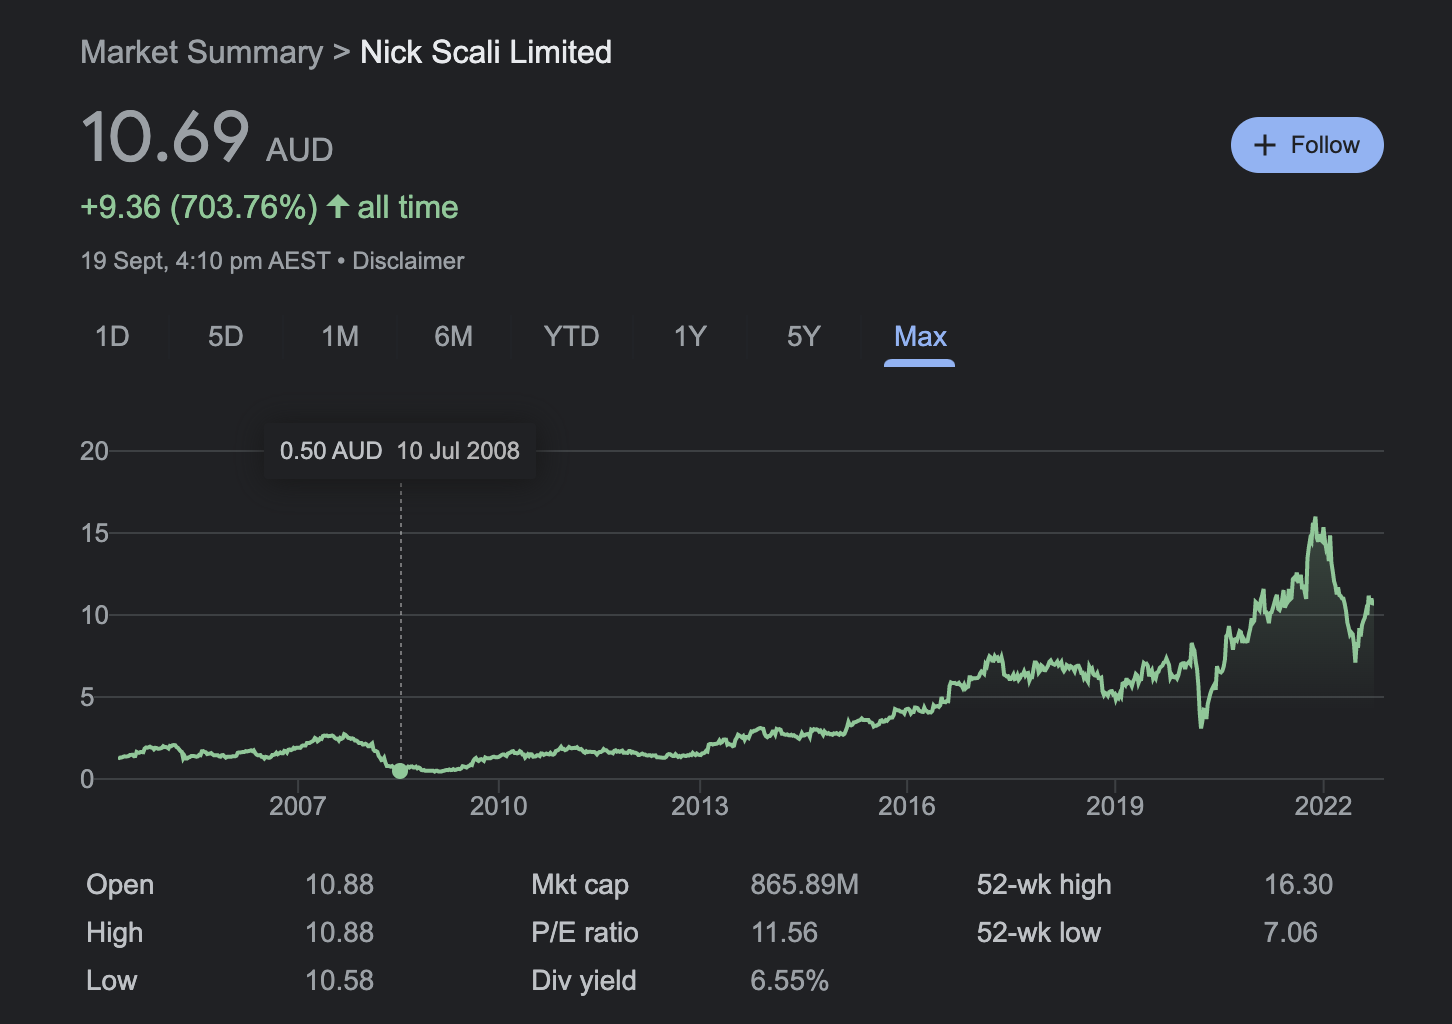
First place I went was the share price - Nick Scali's share price was at about 2.51 late September 2007, it slides over the next few months hitting 0.50 by July 2008.

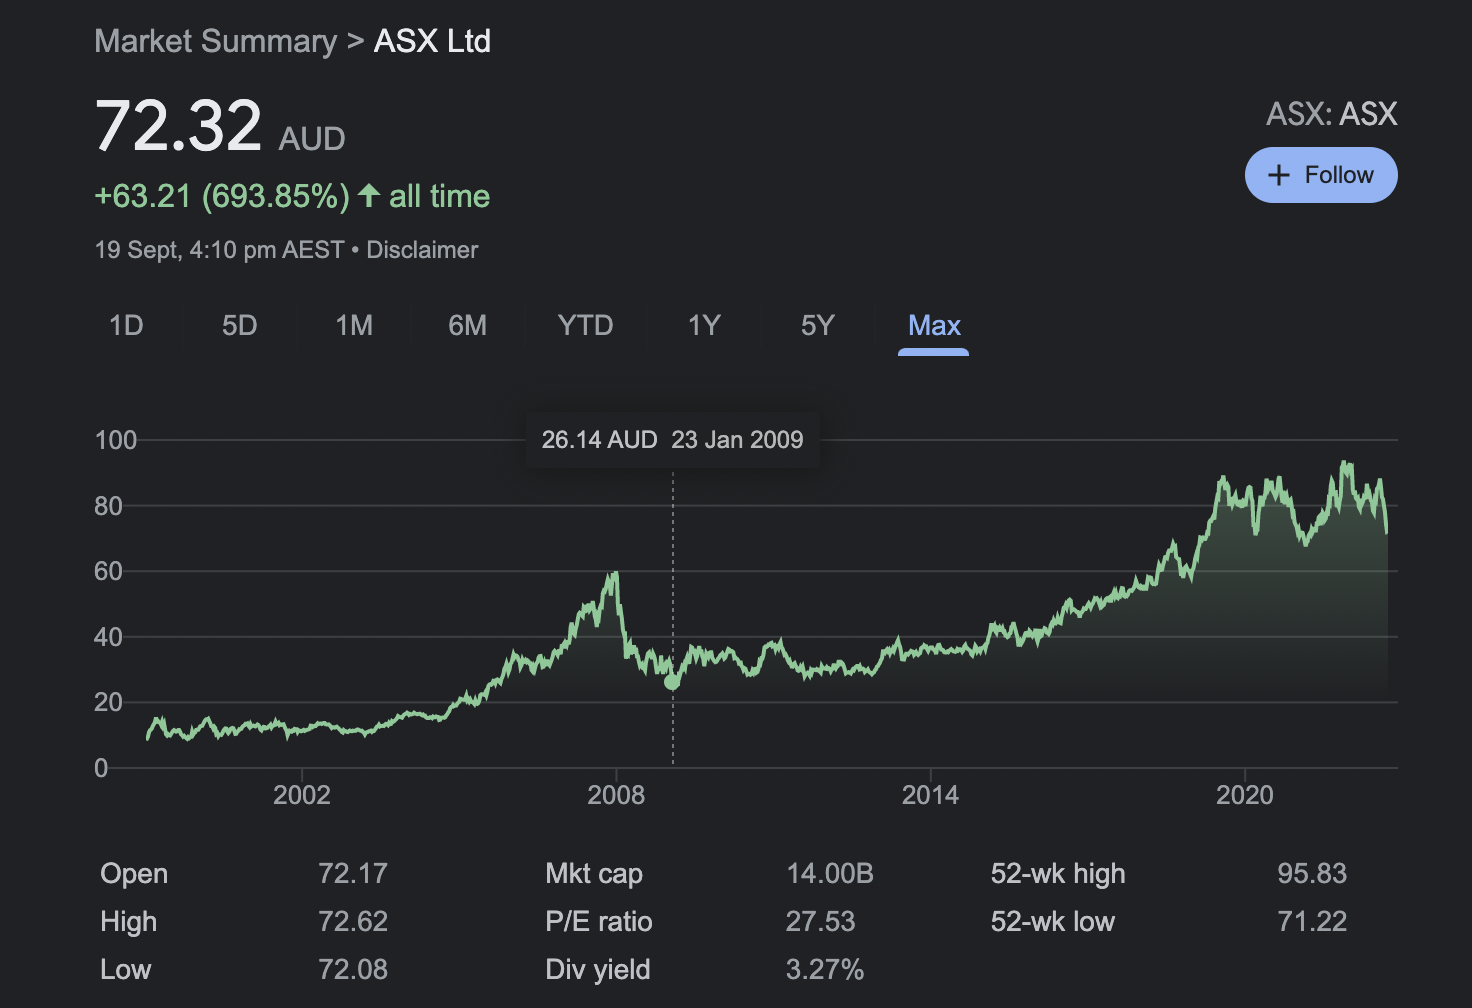
Comparing to the ASX over the same time period leads me to believe people were bailing on Nick Scali long before the rest of the ASX took the big hit, which began at the start of January, and by late January had hit rock bottom. The ASX drops by about half, but Nick Scali really gets hammered and ends up being around 20% of its original price.

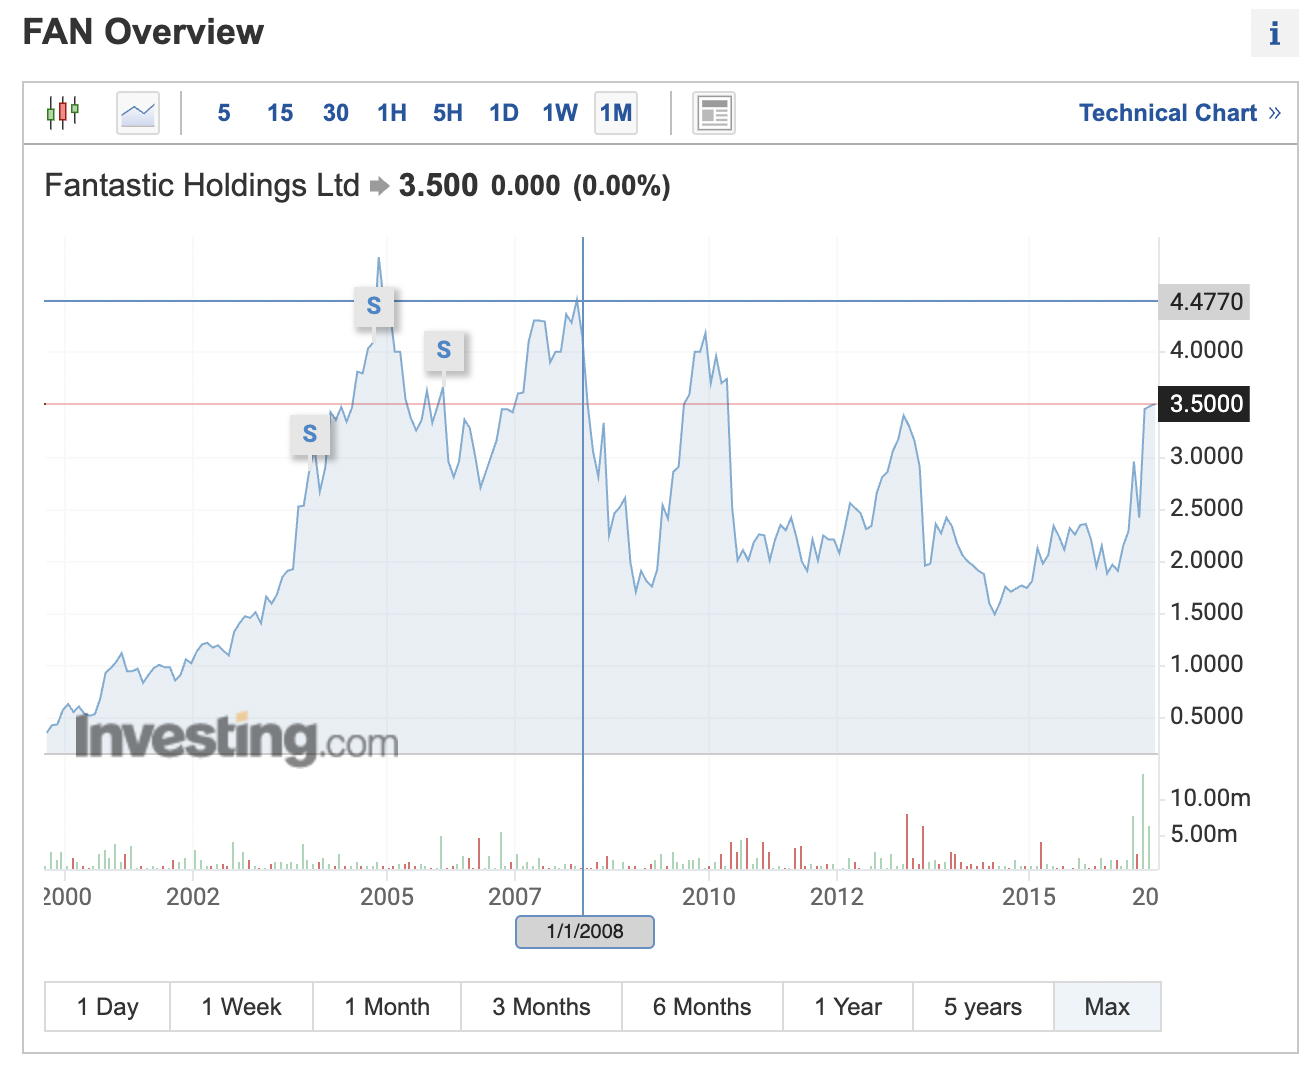
I managed to dig up fantastic holdings (ASX:FAN) - which you can't really get to from Google finance since they delisted.
Their pattern went like this:


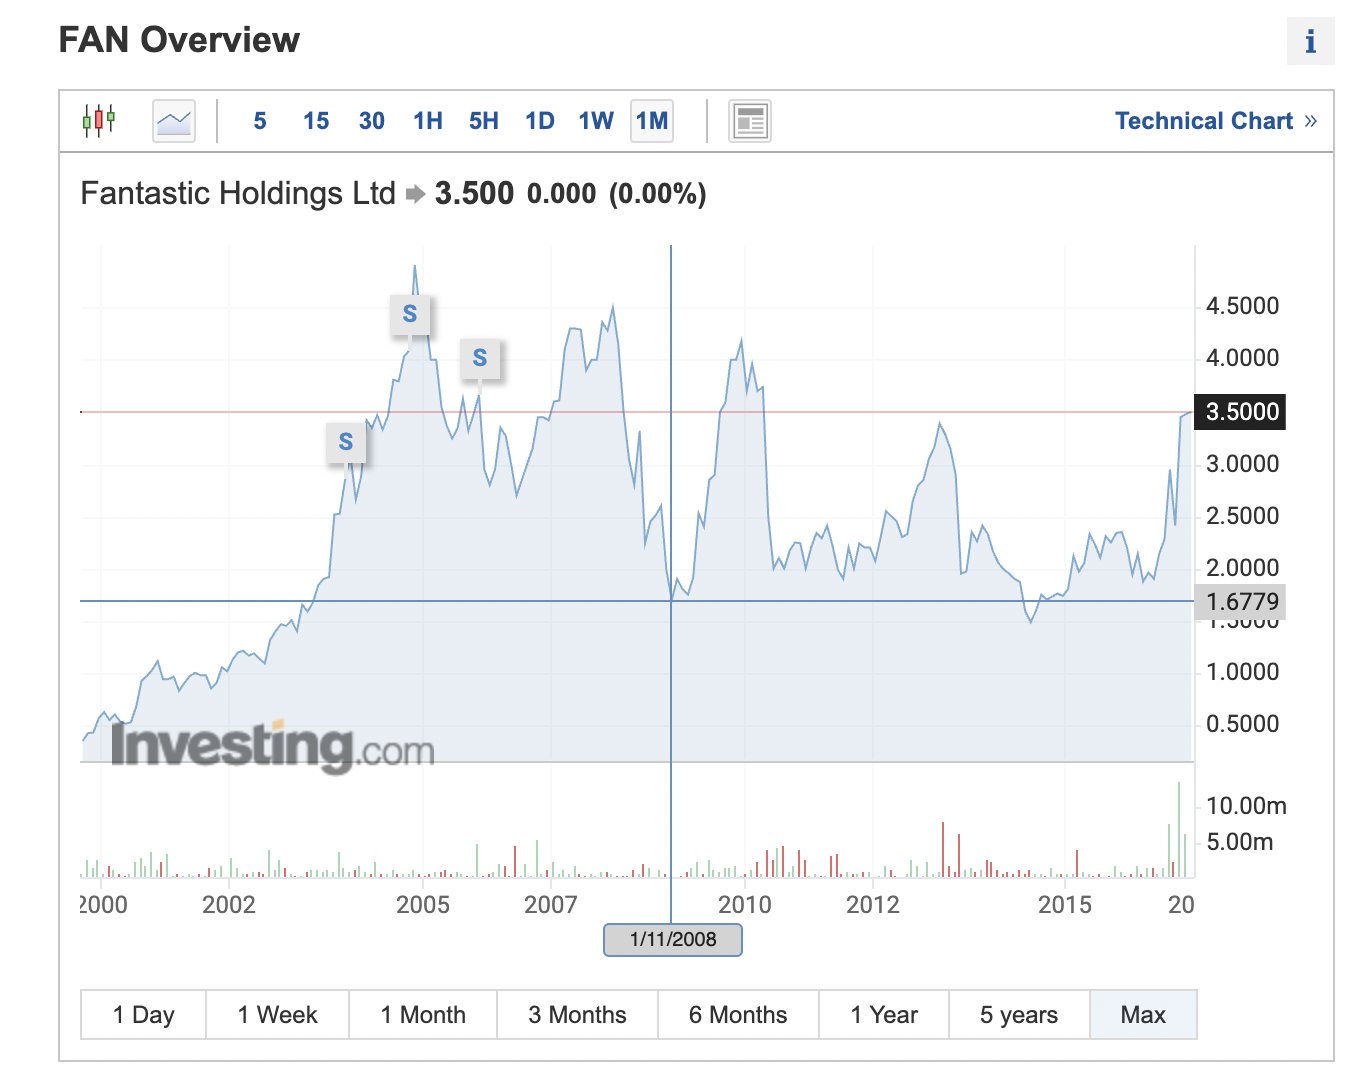
Following the ASX drop Fantastic holdings over 11 days drop from about 4 dollars to around 1.68 - a similar decline in price - much, much faster, and they recover extremely fast compared to Nick Scali. Yet Nick Scali ultimately beats them in the long run. So why did Nick Scali's price drop sooner than FAN and why did it take so long to recover?
I had a look at an unrelated retailer (JBH) to see if the pattern was similar to NCK or to FAN and found their pattern to be much closer to FAN in duration - but the hit there was 20% to their share price and not the massive hits these furniture retailers got.
Looking at news articles around 2008/2009 focusing on Nick Scali, they paint a pretty grim picture for NCK
https://www.smh.com.au/business/hard-times-hit-nick-scali-20080815-3wej.html - Hard times hit Nick Scali
https://www.smh.com.au/business/tougher-times-hit-furniture-retailer-nick-scali-20090213-876x.html - Tougher times hit Nick Scali
Articles like these don't do great for sentiment. Even when the articles get more positive in 2010, the share price barely budges.
https://www.smh.com.au/business/nick-scali-shares-jump-on-higher-profit-20100219-olig.html
Looking at their dividend history
Their dividend took a hit twice. In October 2008 it was almost halved from the previous final. In March 2009 it was completely absent.

I wonder if the signal of them slashing the dividend caused some shareholders to run to the hills, and not return until it was clear that there was stability. They made a sensible play, but maybe the sensible play turned off the shareholders who were in it for the dividend?
Some stuff I gleaned from annual reports from 2008-2014
They had 2 consecutive drops in EPS, in the FY08 report they showed what happens when you're in a high interest rate, high fuel price environment (sounds familiar) - they start dipping their EPS, in FY09 - the financial crisis had hit, we had a government stimulus (but come on 900 bucks ain't going to buy you a piece of Nick Scali furniture) and so the first half they have a pretty bad time, but some level of recovery in the last half. In 2010 things are looking up, yet their share price just doesn't follow the recovery. It isn't until we start seeing big double digit growth (36%) in FY13 that their share price begins to start picking up.
So what might I expect if I bought NCK today?
If they follow their history, and we really do find ourselves in an environment thats hostile to NCK then we might see a significant drop with the share price going sideways for quite some time, potentially with a dividend being slashed/gone for a little while - but the business itself has demonstrated it can endure through these times and if you were lucky enough to buy them when no one wanted them you'd have made out like a bandit.


