


Coming back to @jcmleng question from a charting perpsective with Elliott Wave Theory and Fibonacci levels applied to it from the lows of 0.035 back in July 2020 ish. is looks like the following
Left chart 3d right is 1d
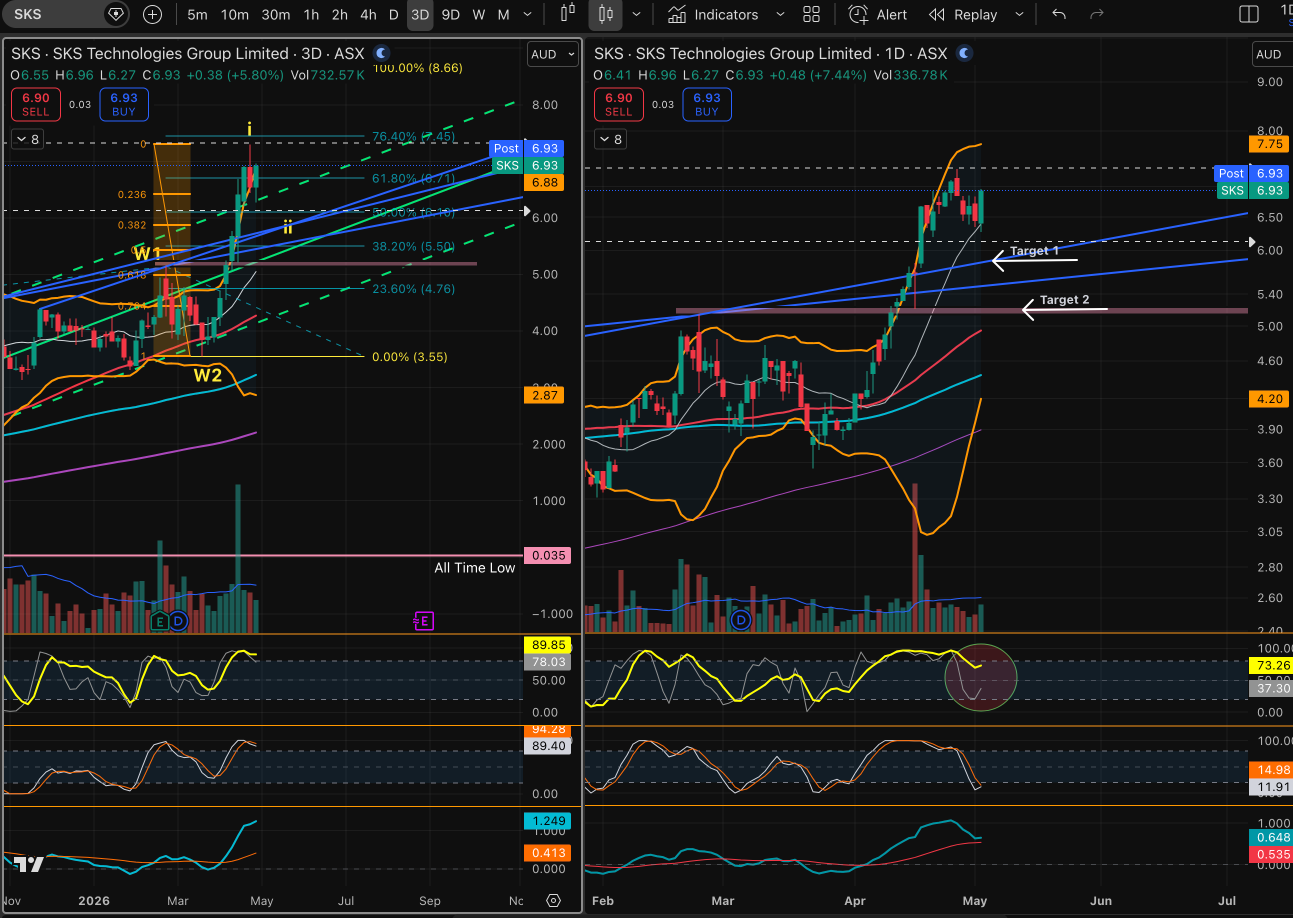
The rising green Lines on the left chart is the LRC (linear regression channel). When it is above and ouside of the top or bottom dashed green lines like this, it usually means it is very extended past the mean ( being the solid green line running up the centre). It works kind of like the Bolinger Bands with a standard deviation of 2.0. As JCM stated, is has retrace to the 23.6%. I make it that it has just completed a W(i) on the 3d. While the compnay has great prospects and has won solid cotract I would like to see it retrace further than what it has so far.
Today has a nice poisitive green bar which is in golf the past three days of trade, so obviously the market is keen to push ahead. Also, stochastic shown below with the circle around it in the indicators also leads you to believe it's making another push. Currently, I believe it's quite exhausted to be that far above the three day LRC line. The three day stochastic is very high, & so too is the weekly and one month stochastics. The question is, will this push up over the next week end up being a double top, then seeing it fall to the levels I'm after or will it continue to push on (it's been known to happen just think of DRO).
For myself, I would not be comfortable in taking a position at the moment with the indicators looking like they are. I will wait and see