Investors will often reference terms such as annual recurring revenue, lifetime value, cost of acquisition, churn and gross margin and others when discussing software as a service — or SaaS — companies.
“The lifetime value to cost of acquisition ratio is 4x and they are growing revenues at 50% per annum! Despite the fact they are loss making, they are such great value at 15x sales – trust me!”
These concepts aren’t difficult at face value, but there are a host of nuances and pitfalls you need to be aware of.
Lifetime value, for example, is simply the total worth of a contract or customer over their lifetime. But if a young company is quoting a lifetime value of 7 years and they’ve only been operational for 4 years, how can we trust they are telling the truth?
The SaaS business model is (heavily) reliant on long term recurring revenues eventually making up for the upfront hit from acquiring and onboarding a customer. So some kind of confidence on the lifetime value metric is crucial to evaluate the viability of a business model – there’s no point spending $1 if you are not confident you will get at least $1 back, right?
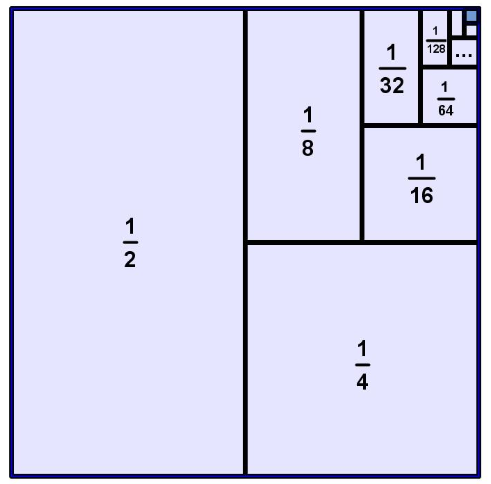
Enter maths, and the beautiful world of infinite geometric series. Here is a visualisation of the infinite sum ½+¼+⅛…+½^n=1. Despite being infinitely many terms, the sum of those terms is finite. Lifetime value is calculated in a similar way using churn.
Let’s say our SaaS company in question just sold 10 yearly recurring contracts worth $100/yr each (or $1000 total). The company estimates from past data that the ‘retention’ is 90% – that is, one contract in 10 does not renew each year. ‘Churn’ is the other side of the same coin; the average amount of contracts that don’t renew. 10% in our example.
Let’s have a look at what these revenues will look like:
$1000+$900+$810+$729+……. And so on, forever decreasing and positive. Given the numbers are decreasing (eg we are multiplying each successive term by a number less than one), there is a simple formula we can use to work out the infinite sum here.
Infinite Sum = annual subscription/(1-retention) = $1,000/(1-0.9) = $10,000
So the average value of a customer is $10,000. Ain’t that beautiful?
But to make matters more interesting, we have a certain discount rate for future cash flows, and those contracts aren’t all profit either! For example, if we know we can get 10% a year by investing in an Australian index, then we are (in theory) indifferent to receiving $1 now or receiving $1.10 next year – it’s of the same intrinsic value to us ($1.10/1.1=$1). We also need to multiply cash flows by our gross margin – we don’t get paid based on revenue, we get paid from profits.
So in reality, our cash flows (with a gross margin of 85% and a discount rate of 10%) look more like this:
$1000*0.85 + $1000*0.85*0.9/1.1 + $1000*0.85*(0.9/1.1)^2 + $1000*0.85*(0.9/1.1)^3….
That’s a lot to calculate, but fortunately we can borrow from the formula above.
Here the first cashflow is the gross margin multiplied by our initial yearly contract value (our gross profit in the first year). And the multiplicative factor is retention divided by the discount rate, in this case 0.9/1.1.
So the general formula for lifetime value of a contract is:
LTV=Gross Margin x Current value/(1-Retention/Discount rate)
In our example, the LTV = (0.85 x $1,000) / (1 – 0.9/1.1) = $4,675
That is, each customer we win is worth $4,675 in today’s money. The higher this is above the client acquisition cost (CAC), the more profitable the business.
Of course, the LTV is captured over the lifetime of a client, while the CAC is all expensed upfront. That’s why a lot of SaaS companies look so terrible on the income statement (indeed, the faster the growth, the bigger the loss!) But at a point, these companies hit an inflection point where annual cash flows cover the cost of new customers, and profits start to gush.
Well, that’s the hope at least. That’s why investors need to keep a close eye on retention rates, gross margins and acquisition costs.
To dig into other investment insights, head on over to our company reports where you’ll find a host of valuations and perspectives from a community of experienced private investors.
Strawman is Australia’s premier online investment club. Join for free to access independent & actionable recommendations from proven private investors.
Disclaimer– The author may hold positions in the stocks mentioned in this publication, at the time of writing. The information contained in the publication and the links shared are general in nature and does not take into account your personal situation. You should consider whether the information is appropriate to your needs, and where appropriate, seek professional advice from a financial adviser. For errors that warrant correction please contact the editor at [email protected].
This Service provides general financial advice only, and has not taken your personal circumstances into account. Strawman Pty Ltd operates under AFSL 501223 . For more information please see our Terms of use. Please remember that share market investments can go up and down and that past performance is not necessarily indicative of future returns. Strawman Pty Ltd does not guarantee the performance of, or returns on any investment.
© 2019 Strawman Pty Ltd. All rights reserved.
| Privacy Policy | Terms of Service | Financial Services Guide |
ACN: 610 908 211 | Australian Financial Services Licence (AFSL): 501223