Pinned straw:
We now have a RL holding in Duratec (2.4%). I probably rushed into this a bit too early given the $388 million order book at 1H24. However, I’m here now, so it’s in my best interests to keep an eye on the pipeline of work. I am hoping to get some insight into what lies ahead to help with decisions for our holding. To help with this I’ve developed a Pipeline to Profit Model (another spreadsheet of course!).
Since listing, Duratec has consistently reported the dollar values for the pipeline of work, tenders and the order book for each half year. They have also reported EBITDA, NPAT and the margins for each. This comprehensive data makes it possible to model the historical dollar flows from pipeline to profit, and to see if there are any relationships that might be useful in forecasting profits. If they were to stop providing this data I think that could be an orange flag.
In the spreadsheet below I’ve modelled the dollars flowing from pipeline to profit assuming average lag times between each stage, noted in the column headers. I’ve assumed lag times of 6 months from pipeline to tenders, 6 months from tenders to order book, and 12 months from order book to revenue. This assumes an average lag time of 2 years from pipeline to profit, which sounds too short, but it will serve to test the model. I think the model could be very rubbery at this stage, but it’s somewhere to start and the aim is to update and improve the assumptions over time.
I’ve colour coded the dollar flows across different stages of the pipeline, and used black text for actual data, blue text for guidance, and red text for forecasts.
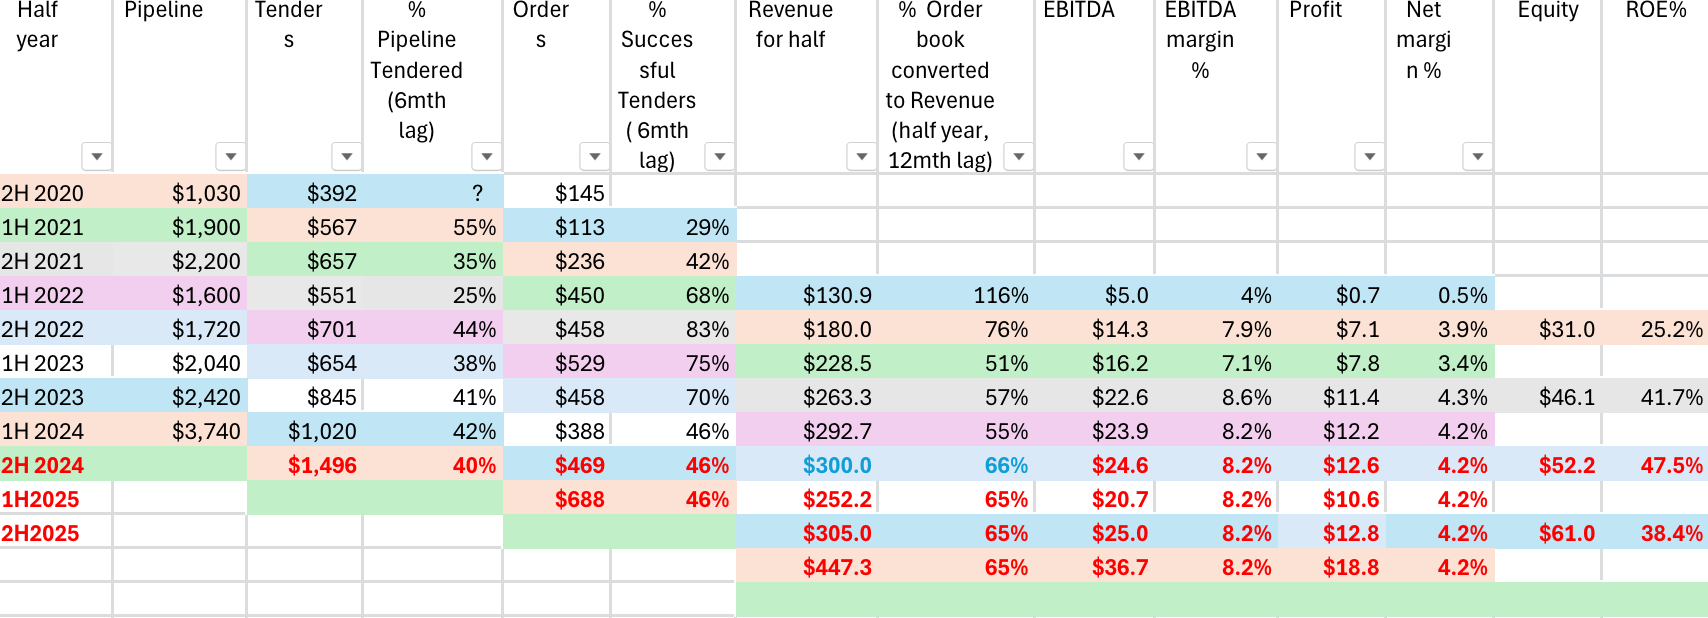
Analysing the conversion percentage for each stage in the pipeline, there appears to be some relationships that might be useful in forecasting profit. The conversion from pipeline to tenders ranged from 25% to 55%, narrowing from 38% to 44% over the last 2 years. For forecasting purposes I’ve assumed 40% of the 1H24 pipeline could result in tenders, ie c. $1.5 billion in tenders for 2H2024. Of course the lag times might be out of whack, and that won’t be very useful. Time will tell!
There seems to be more variability in the conversion of tenders to order book (contract wins). The conversion rate increased from 29% to 83% between 1H2021 and 2H2022, and then fell each half to 46% for 1H24. That means less than half of the projects tendered for resulted in a contract. It would appear that Duratec has become more focused on maintaining margins than in winning additional contracts, which is a good thing. Assuming 46% of the tenders would result in contracts, the 2H2024 order book could be c. $470 million.
Conversion of the order book to revenue has ranged from 51% to 66% for each half year. This makes sense as you might expect more than half of the order book would be converted to revenue each half year in the year/s of delivery due to the order book growing (not shrinking?). I’ve assumed 65% of the $388 million 1H2024 order book would be converted to revenue in 1H2025, resulting in 1H2025 revenue falling to c. $250 million. NPAT might be c. $10.6 million using a net margin of 4.2%. Based on this model NPAT could fall from c. $24.8 million in FY2024 to $23.4 million in FY2025 (5.6% lower).
The next update to look out for will be Duratec’s guidance for FY24. Last year this was released on 24 April 2023. We should have an update on the order book within a month, and hopefully it’s up on the $388 million at the 24 November 2023, or that could spell trouble!
Last year the FY23 results all came in at the top end of the upgraded guidance provided in April 23. I like to see this with guidance. I think Duratec is in for a record profit this year, but it’s the order book, the pipeline of profits, the margins and the ROE that we need to be watching.
mikebrisy
@Rick this is great analysis. FWIW, I think 2 years pipeline-to-profit is not unreasonable given that the majority of the revenue base is small jobs. For some of the bigger jobs, I think you are right in that it might be a bit tight.
From my time in the capital projects space, incremental brownfield jobs have a shorter life cyle than new infrastructure. Jobs that are about asset surveys, inspection and refurbishment/ life extension should be in the owner asset life cycle management plans. I guess the question is over what timeframe they become visible to the market so that they can appear in a pipeline. A public funded organisation, like defence, might be more open about their asset management plans with their supply base, whereas private firms probably only give visibility of work when they are in the budget period (year) before the work is done, so that they have quotes that can then refine their assumptions in the year in which execution starts.
Secondly, some remediation/extension work is identfied reactively - particularly where it relates to unexpected defects. For example, if a condition survey or asset inspection identifies defects that then triggers the need for a project. Many defects are non-critical and are rolled forward multiple times (years) as the maintenance or capital spend is "optimised" at each annual budget-setting. But when a critical defect gets added to the scope it can crystallise the need for the refurbishment project. Often, there is no budget in the current year beyond the survey work to properly scope up what is required, and so it then goes into the next year's budget. This is another reason why your 2-year pipeline-to-profit timeframe workds from my perspective.
The experience I am drawing on here is just from energy and transportation infrastructure - mostly international, although some Australian. So, it would be interesting to understand what it looks like in $DUR's client base.
@Strawman last had Chris Oates in for a SM meeting in June 2023, so perhaps he could be booked for a return visit this June? (Apologies, if we've already asked) This would allow us to ask questions about pipeline and tender management and tune your model, which would mean that by the time we get the next update at FY24, we'd be better equipped to interpret the information, as I am very keen to understand this better.
Wini
@Rick worth noting that with Dep of Defence a key customer for DUR, you can search Austender for anything they have won from them in the past:
https://www.tenders.gov.au/Search/KeywordSearch?Keyword=duratec&submitSort=Go&OrderBy=Publish+Date&sort=
I haven't really followed DUR too closely, but after a flurry of contract wins in December and January it has gone pretty quiet since. No doubt lumpy given the business and Government contracting but may be part of the reason for the recent weakness.
Rick
Thanks @mikebrisy. It’s good to have your experienced point of view on the model. I must admit using average time frames is a bit course, but I hope to refine it as I find out more about the project rollouts. Yes, it would be great to have Chris Oates join us in an interview with @Strawman. After the FY24 guidance update would be good, perhaps early June?
Bear77
I've appreciated the insights and analysis on DUR by a bunch of our knowledgeable and experienced contributors here recently; thank you @Rick , @mikebrisy , @Wini , @Karmast, @Solvetheriddle, @raymon68 and @Shapeshifter - and also @UlladullaDave and @mushroompanda for that trip down memory lane with FGE; I did hold Forge Group back in the day but thankfully got out just before they went under - locking in a loss that could have been significantly worse. I have been reading it all and mulling it over, and I bought some DUR in a real money portfolio this afternoon @ $1.135 (which also ended up being their closing price for the day) after selling my JLG shares out of that portfolio. It's not apples for apples, as they do operate in different sectors, and have different value drivers, but based on their respective 3-year fundamental ratio trajectories and most recent reports, DUR looks heaps better to me:
Here's a little of what I don't like about Johns Lyng Group (JLG):
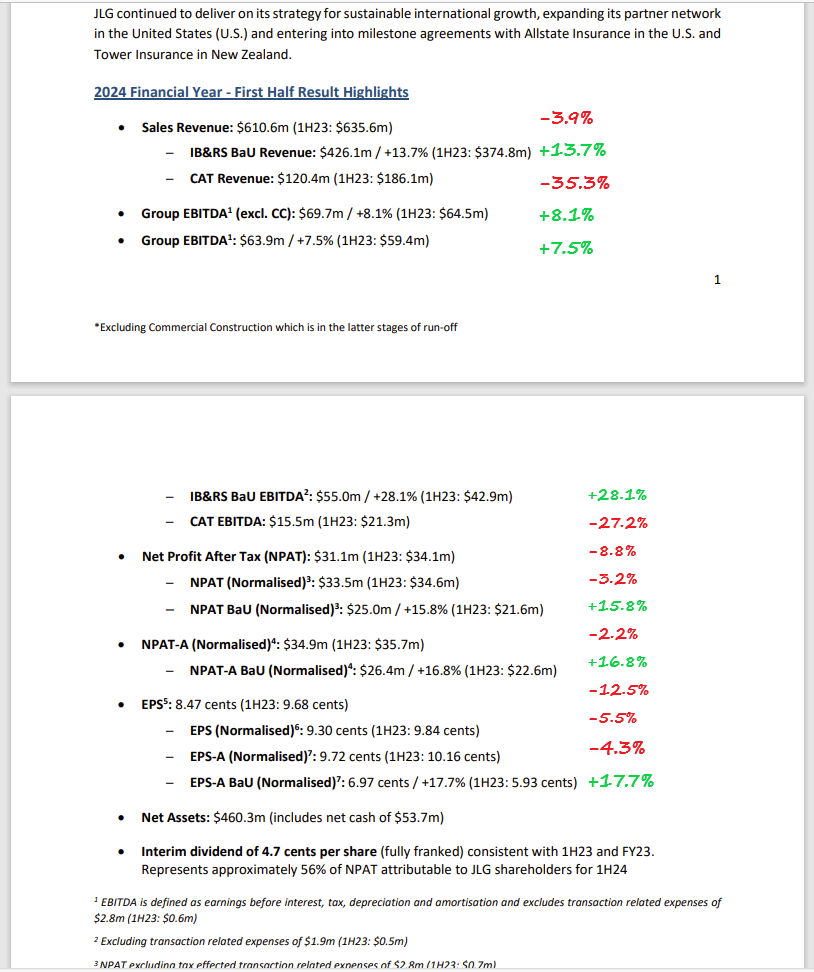
Source: JLG-1H24-Results-Announcement.PDF [27-Feb-2024]
JLG's revenue down -3.9% but NPAT down -8.8% and EPS down -12.5%, so reducing margins.
They split their revenue up into BaU - Business as Usual - and CAT - Catastrophic events such as floods, cyclones etc. - but it's their total revenue and total NPAT that matters most, especially now that they're expanding into the USA. There were plenty of CAT events in eastern and north eastern Australia in H1 (the 6 months ending 31-Dec-2023) as well as the prior 6 months, but their CAT income dropped -35.3% compared to the PCP (previous corresponding period, i.e. the 6 months ending 31-Dec-2022) and their CAT NPAT hasn't been declared but it's bad enough that it dragged their total group NPAT down to a lower number than the PCP.
I also note that they do not provide ANY percentages when the result is negative (meaning a lower number for H1 of FY2024 than for H1 of FY2023), the percentage is only included when the number has shown positive movement, which is poor form, and not good IMO. I have put those red and green numbers in myself - the green ones they had disclosed because they're positive, but the red ones I had to calculate and include myself.
OK, now to Duratec (DUR):
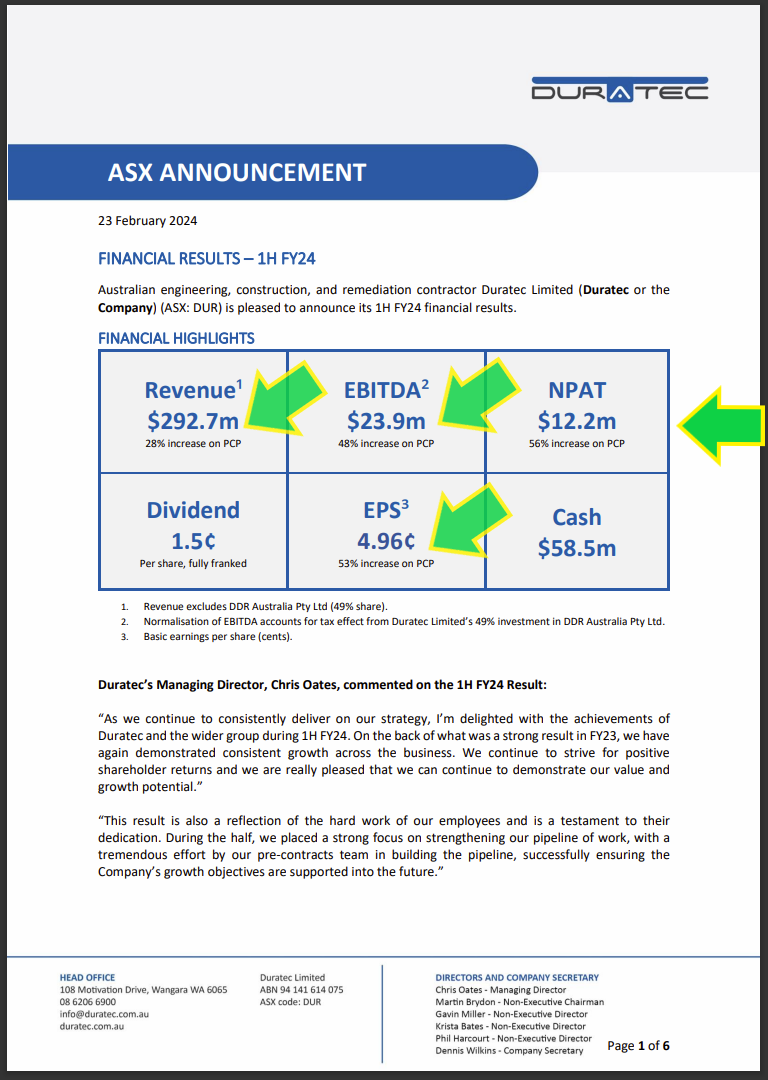
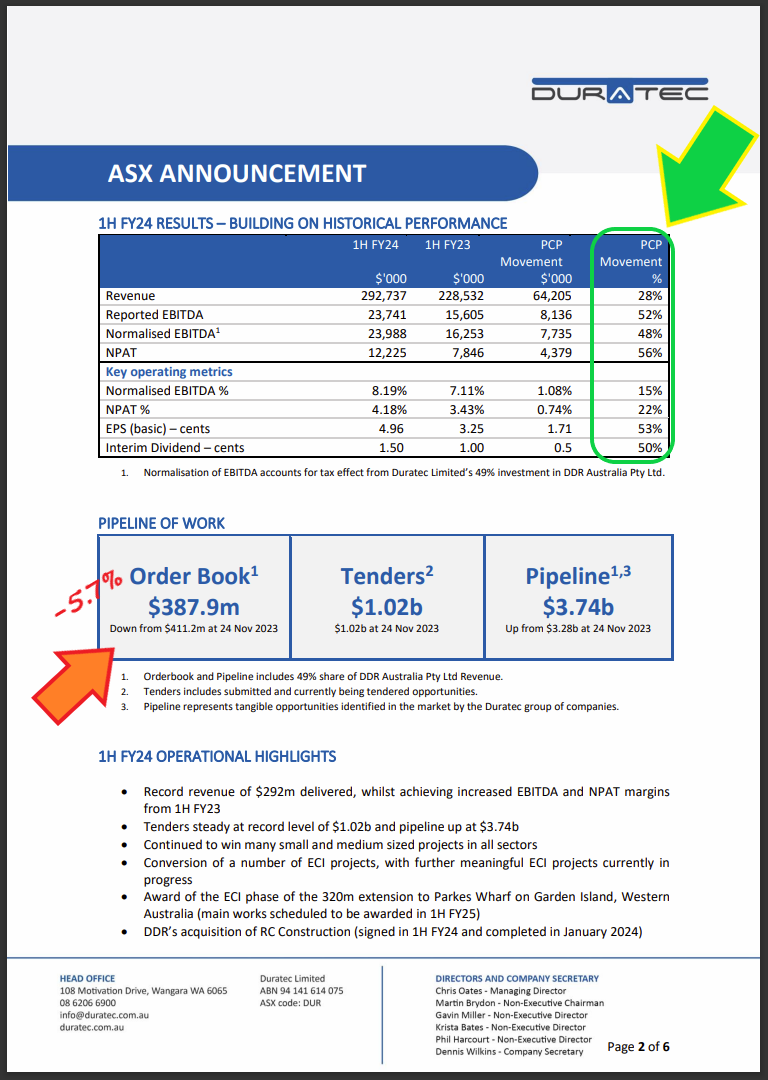
Source: DUR-Financial-Results-1HFY24.PDF [23-Feb-2024]
See also: DUR-Results-Presentation-1HFY24.PDF [23-Feb-2024]
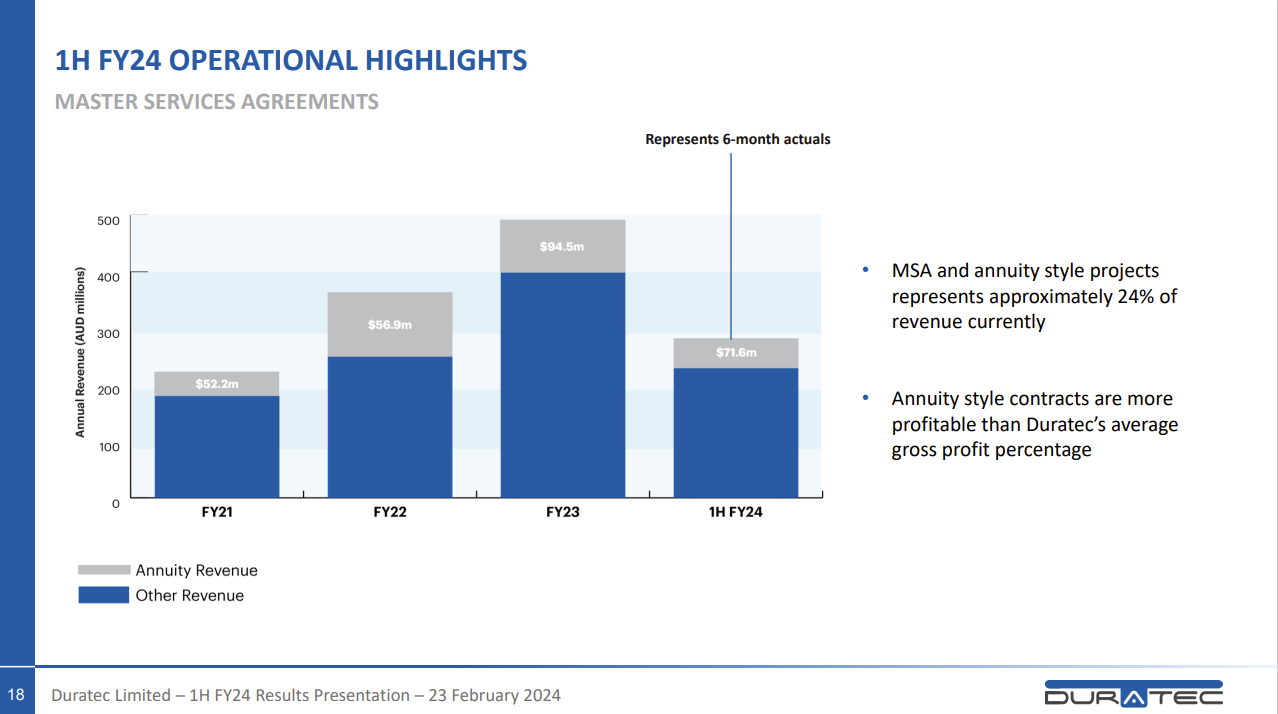
So DUR have EVERYTHING moving in the right direction except for their order book being -5.7% lower at $387.9m on 31-Dec-2023 than it was on 31-Dec-2022 ($411.2m), and the same amount of tendered work, rather than a greater amount. And that doesn't phase me too much because while they do have almost one quarter (24%) of their revenue coming in as recurring revenue from Master Services Agreements (MSAs) and annuity style projects (see first slide below), the other 76% of their revenue can be a bit lumpy as with most E&C (engineering & construction) companies, so the Order Book will fluctuate - but it's the overall trajectory of their revenue, earnings, and most importantly EPS that matter most, and they're all heading up.
DUR also have good diversification of revenue across sectors with their main revenue coming from the Defence, Mining & Industrial, and the Building and Façades sectors/sub-sectors, plus a lesser amount from the Energy sector plus "other".
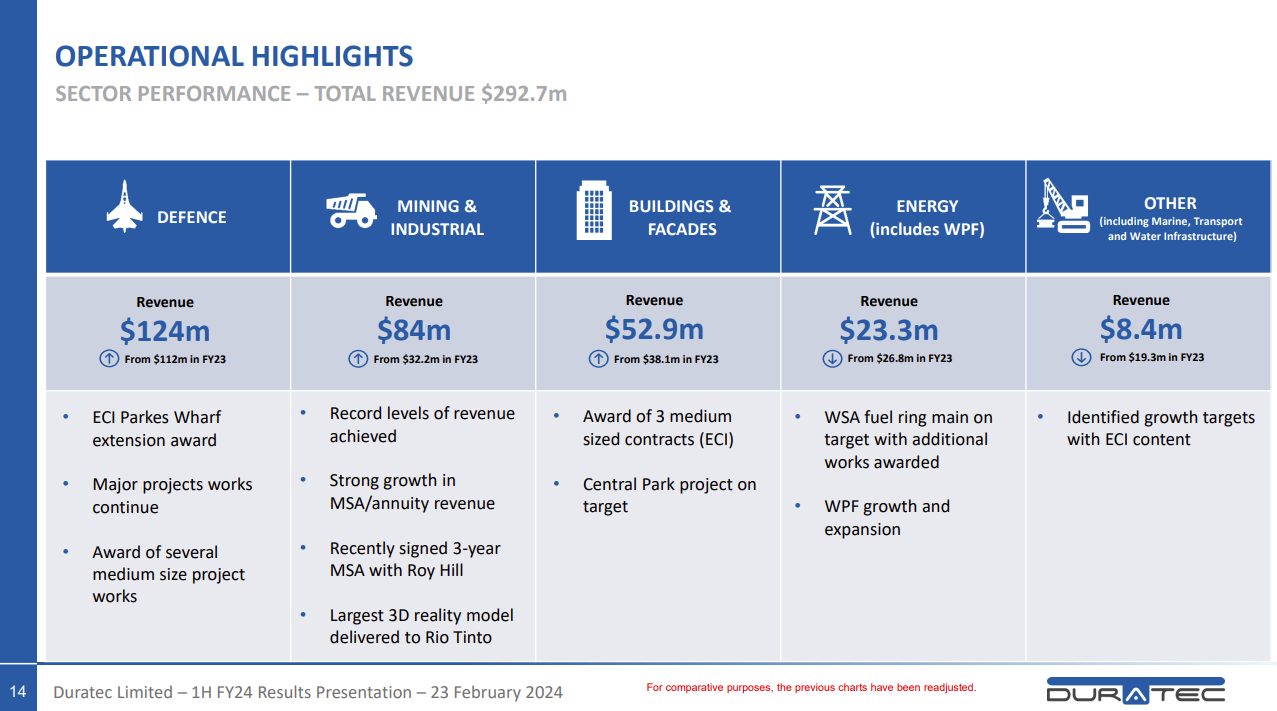
With 42% of revenue coming from Defence, this is clearly a company that is less reliant on commodity prices than mostly-mining-sector-facing companies like LYL and GNG. By the way @mikebrisy , I loved the following two charts of yours:
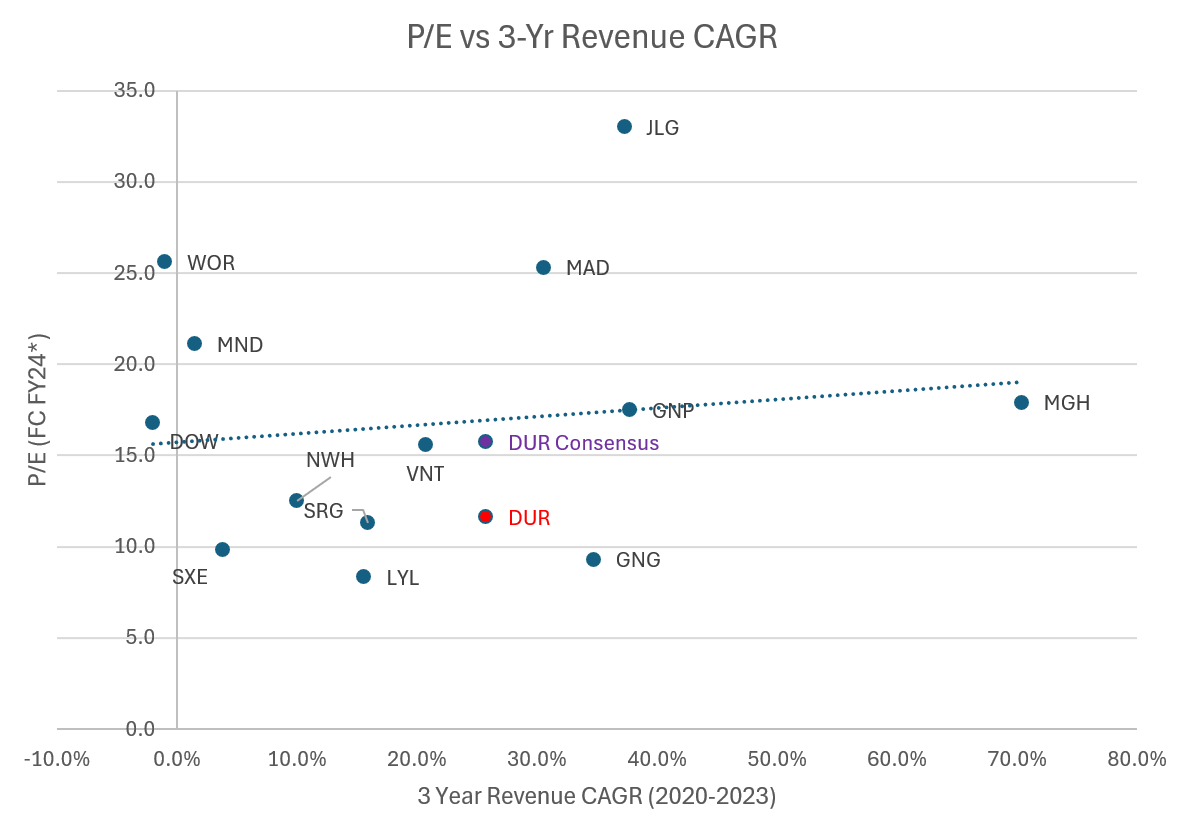
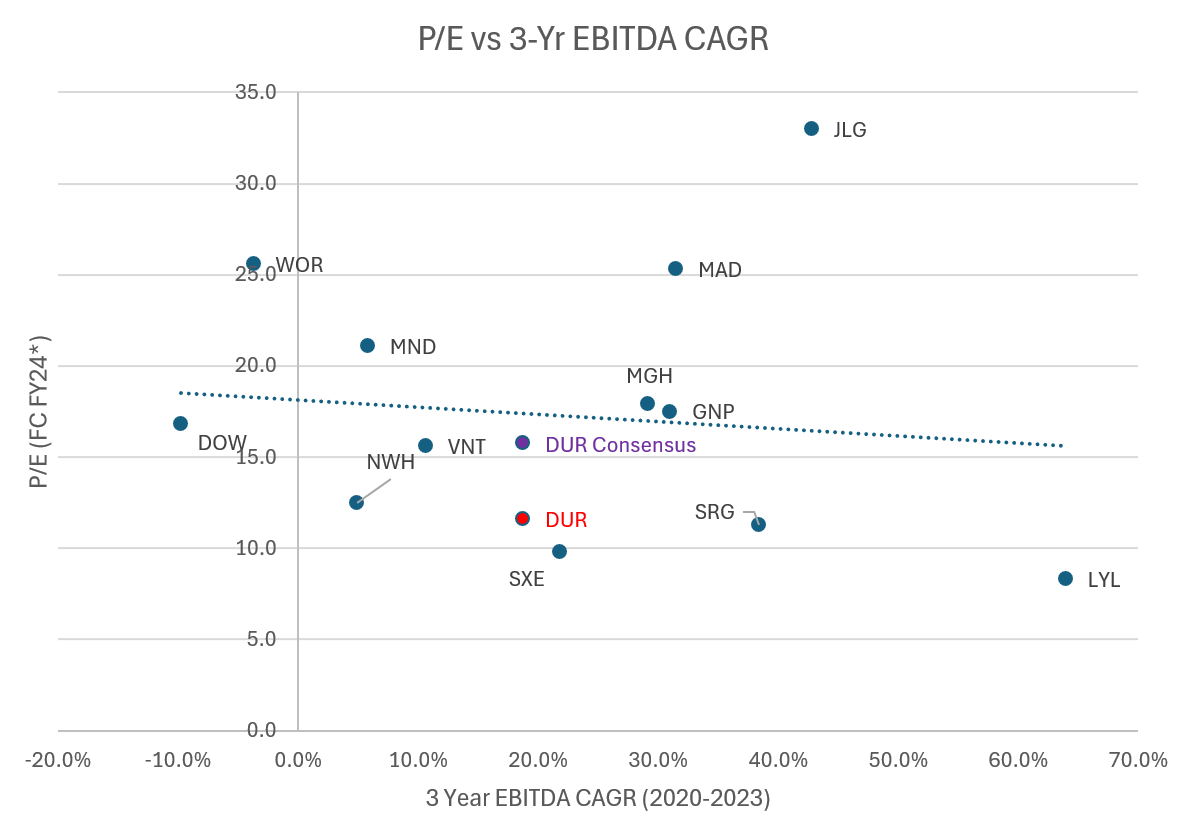
One minor query however - with the second chart there, were GNG off the chart, or were they just left off the chart (omitted)?
Back to DUR; I also much appreciated the following two charts:
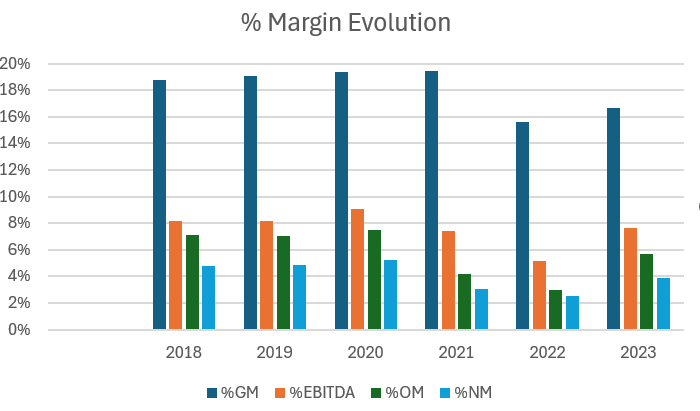
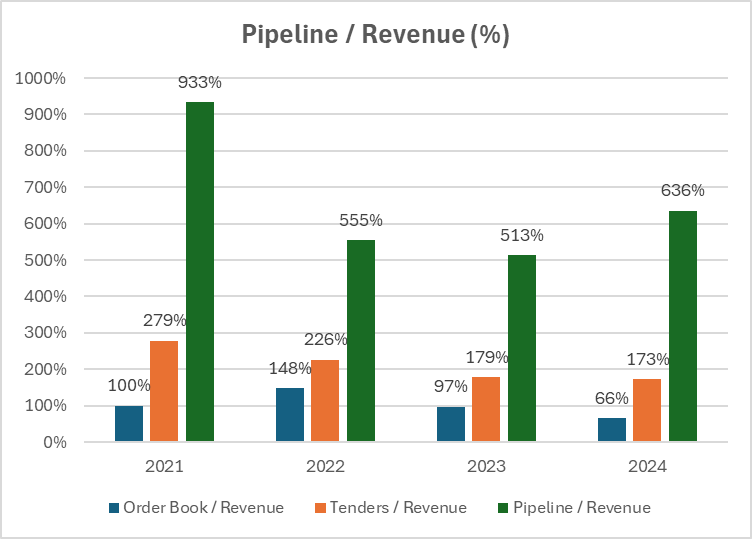
Graph source: @mikebrisy - Those two are currently in posts #16 and #25 (or thereabouts) in this thread: DUR - GET OUT! Deep Data Bear Case (strawman.com)
That opening straw (that starts off that forum thread) is GOLD @Rick !! I did get a few chuckles out of that one. Mathan in particular needs to lift his game - as not knowing about a company is fine, not admitting that you don't know anything about a company is not great, but some of that rubbish that Mathan was spouting didn't even make any sense, and some of it wouldn't have made sense in relation to ANY company...
With that last graph that shows the trend of tenders and pipeline affecting the following years' order book, I do note however that FY2024 is not yet over so there is still time for the FY24 Order Book to grow, however it certainly is interesting how the declining tenders by revenue (orange columns) and total pipeline by revenue (green columns) declining from 2021 to 2022 resulted in a lower order book (Blue) and a lower tender amount (orange) in 2023, then the same thing happened with the decline between 2022 and 2023 affecting 2024, and the light at the end of that tunnel appears to be the increase in the green pipeline column in 2024 which, as mentioned by Mike, Rick and Karmast here already, hopefully bodes well for 2025. As mentioned, this is an important thing to keep an eye on for sure. It's definitely a key to a bear case - if we don't see some increases in all three metrics over the next couple of years.
Lumpiness is OK, but a steady decline in all three of those, as we saw in 2022 and again in 2023 is not OK. If the green pipeline column for 2024 was below 500% there, it would look very bad, with everything in decline, and that's worth thinking about, because their pipeline is simply "tangible opportunities identified in the market by the Duratec group of companies" as they say, so the pipeline is only as good as they are at identifying future opportunities that they may get the opportunity to tender for when the opportunity arises. That said, based on the relationship between all three metrics demonstrated on that graph, they seem to be identifying that pipeline reasonably well, and also then converting a good proportion of that pipeline into tenders, and then converting a good proportion of those tenders into contracted work (order book), so as long as that relationship continues, we should be able to regard their pipeline as a leading indicator of future tender levels and order book (work in hand in future years). So the pipeline remains fairly important in that context, even though we can't be sure just how reliable an indicator it will turn out to be. I'll be watching it anyway.
The additional pipeline/tender conversion to WIH (order book) work that @Rick did in the straw at the top of this forum thread (the spreadsheet) is valuable data and analysis for evaluating that causality or relationships between the Pipeline by dollar value of revenue, the Tenders by dollar value, and the dollar value of the Order Book/WIH, and how those relationships in terms of being future indicators have changed (i.e. the conversion rate changes). I won't repeat that analysis now - it's there and well worth reading if you haven't already.
Looking back across the 3 years that they've been listed, Duratec have made some solid progress, and they have a nice high ROE of over 40%, or they did at June 30, 2023, according to Commsec.
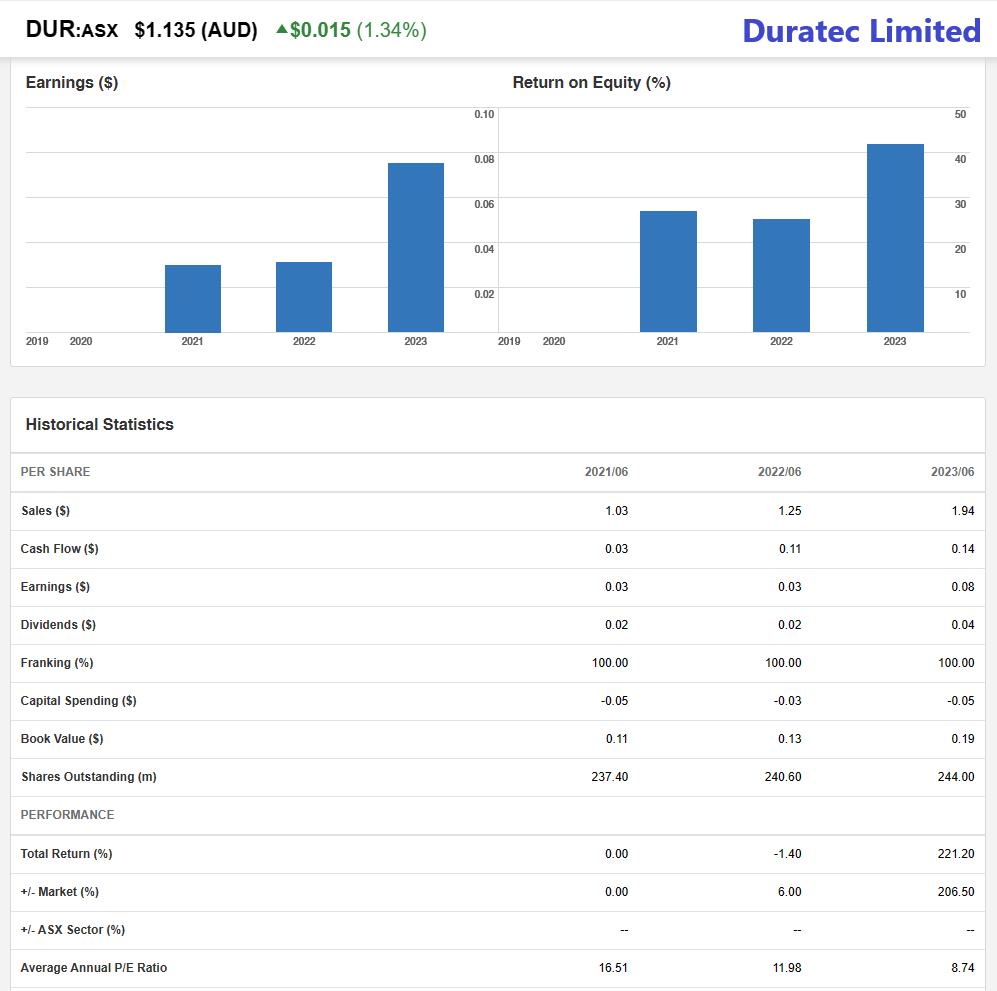
They do screen as cheap, but it's all about whether that growth is sustainable. The market clearly thinks it's not:
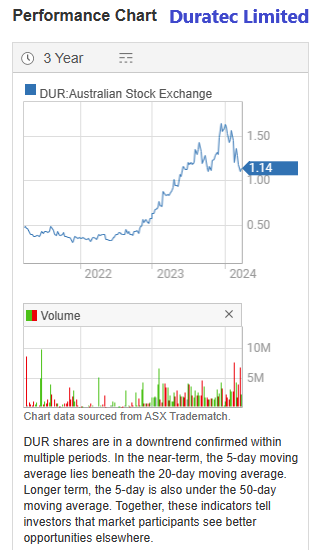
Duratec's SP has reduced just in this calendar year from $1.70 in early January (and an intraday high of $1.72) down -35% to close at $1.10 last Friday (22nd March 2024). They're still well above that 50 cents/share float price (on 4-Nov-2020) of course, but they should be, because they're a bigger and better company now. It was an interesting first day on the ASX for them back on November 4th, 2020: They opened at $0.95 which was +90% above their $0.50/share offer price (IPO price) and during that first day Duratec saw its share price move between a low of $0.58 and a high of $0.95, before closing at $0.61/share, which was 21% above its original 50 cents/share offer price. [Source: https://www.intelligentinvestor.com.au/shares/asx-dur/duratec-limited/float] What happened after that is there on that chart above. They traded below 50 cents for most of 2021 and 2022 before starting a big uptrend from November 2022 that lasted through to the end of 2023 and into the first week of January 2024 - where they hit a $1.72 high, and it's been all downhill from there, but they're still over $1/share.
But are they now cheap or is this just a correction to a share price that overshot to the high side in 2023?
No doubt this IS a correction, but I think they're now probably overshooting to the downside. I'm thinking that anything below $1.20 is probably cheap, and I'd probably buy up to $1.30 with a $1.45 target price for the next 18 months to 2 years, but they could easily shoot well past that if they start to grow their tenders and order book. Time will tell. However, for now, like @Rick - I'm also now a holder of DUR shares in a real money portfolio. I will also be adding them here to my Strawman.com virtual portfolio, once I work out what to sell to free up some cash.

Edit: Additional:
See Also: DUR - Whole-of-Life Asset Management (strawman.com) [March 2024]
and DUR - Claude’s view? (strawman.com) [March 2024]
and DUR - Broker/Analyst Views (strawman.com) [refers to broker reports on DUR from November 2023]
and DUR - DUR valuation (strawman.com) [created 9 months ago, so around June/July 2023]
and DUR - #Low net margins (strawman.com) [created 9 months ago, so around June/July 2023]
and the two forum threads that I've referred to in this post: DUR - Pipeline to Profit Model (strawman.com) (which this post is part of), and: DUR - GET OUT! Deep Data Bear Case (strawman.com) which I've borrowed heavilly from in this post, with attribution to the respective content creators.
Also: DUR - Duratec Limited - Strawman: ASX share price, valuation, research and discussion is the Duratec home page here from which you can see/access all of the content provided by all contributors here.
And one extra graph from the DUR - GET OUT! Deep Data Bear Case (strawman.com) forum, created by @mikebrisy :
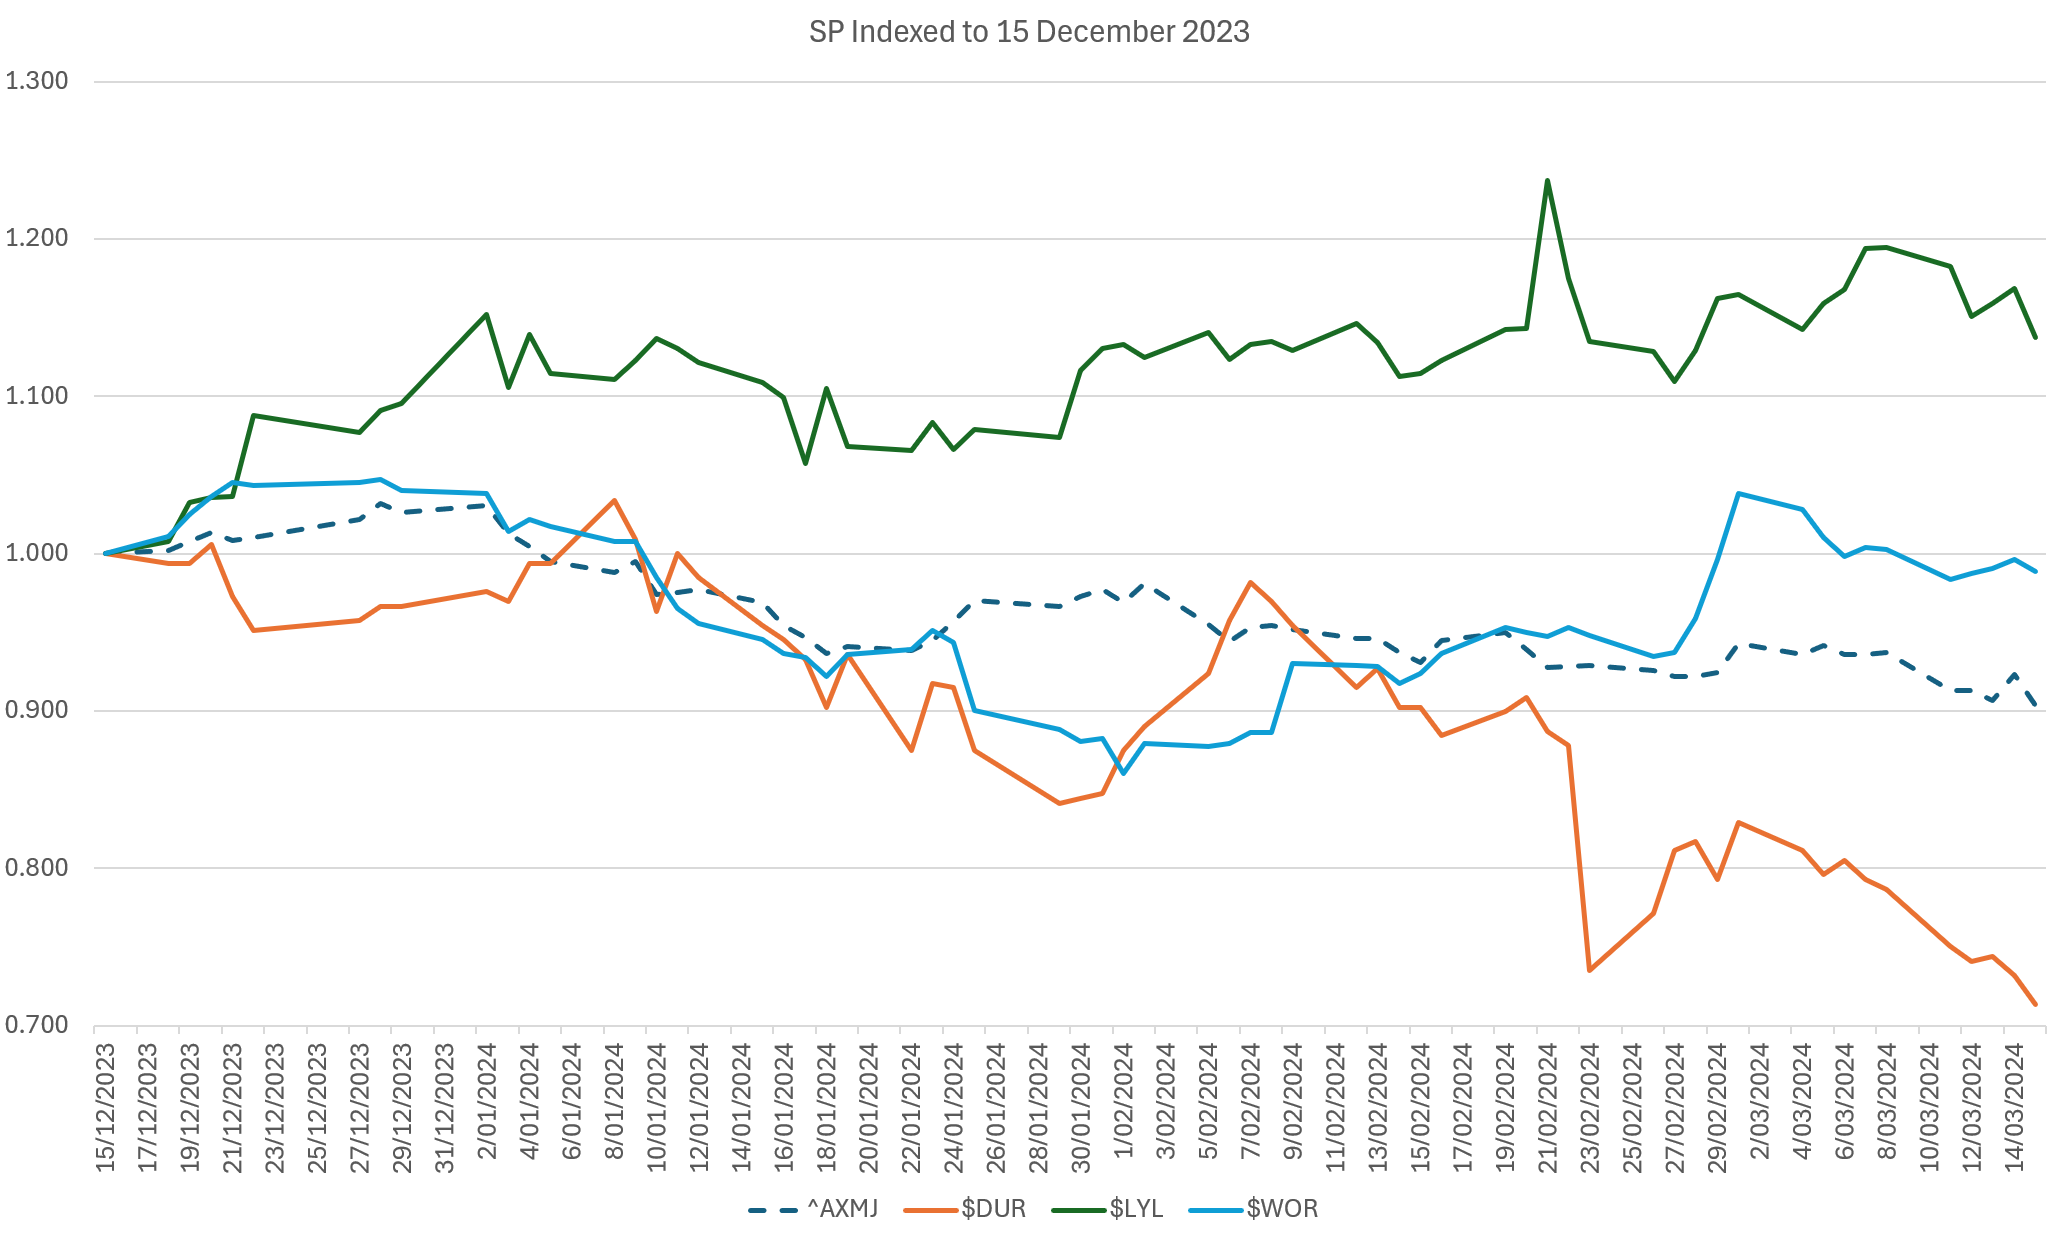
XMJ is the S&P/ASX 200 MATERIALS (Sector) Index.
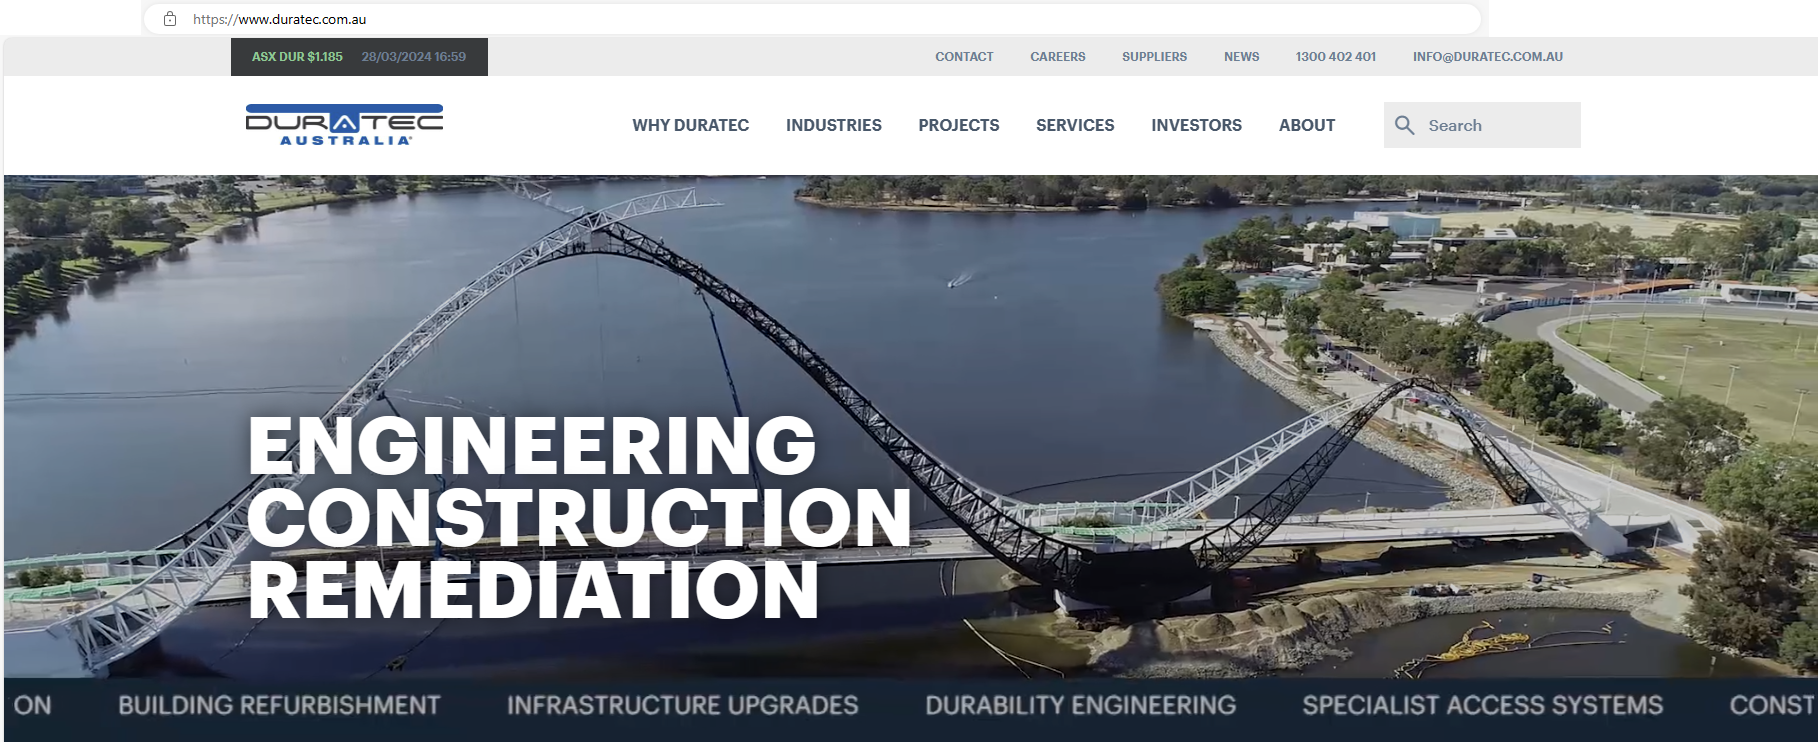
Finally, Duratec's own website is: https://www.duratec.com.au/ [Extend the Life of Your Assets | Duratec Australia]
Rick
Thanks @Bear77. That’s a ripper post! I just love how you’ve pulled everything together in one place and processed everything to come up with a comprehensive story about the business.
I also appreciate the additional info you’ve brought to the table including the annuity versus project revenue and discussion on the lumpiness. I hadn’t looked at that perspective. It’s great how you’ve synthesised what’s important and what we need to watch for.
This is a wonderful synthesis with references and links to all the valuable contributions from others here on Strawman. It would be a shame to leave it here buried in the forum. I can see myself coming back this in future as a point of reference. I’d love to see it as a seperate straw under Duratec where we can find it easily and use it to navigate to the other great work by others…please! :)
Cheers,
Rick
edgescape
For the benefit of the doubt, JLG underperformed on CAT mainly due to dithering with the government on rebuilding for a few cat events.
https://strawman.com/member/forums/topic/8503
I guess it is what it is and perhaps some have been disappointed at the way JLG have disclosed that information now instead of in the past.
Further evidence can be found in the news where some are still haven't been able to move back in to their homes or businesses which will be a drag for JLG.
Bear77
Fair enough about JLG @edgescape - I still have them on a watchlist, as I often do with companies I sell out of, and I may get back onboard at some point. I was not impressed with their reporting however, including the fact that they only provided percentages for the positive movements, and no percentages for the negative ones.
Thanks @Rick - appreciate the feedback, I'm a toddler compared to @mikebrisy when it comes to peer comparisons and creating graphs and basically all of the in depth research that he does, which is truly awesome! However, despite my tendancy to waffle on quite a bit most of the time, I have been told I do have a knack of pulling important stuff together and presenting it in a readable way, so if that helps, I'm happy with that. I've just created a very short "Bull Case" straw for Duratec which simply has a date, an SP, and a link to that post.
mikebrisy
Thanks @Bear77 and I echo @Rick in saying you've done a great job in pulling together in one place our collective "deep dive" into $DUR over the last couple of weeks.
First, to answer your question on the omission of $GNG from the EBITDA chart, my data source shows an EBITDA loss in 2020, so it was omitted.
For me, this is where the Strawman community is at it best - different perspectives and analysis, bull and bear. I agree it would be great to have the post created as a separate Straw: $DUR Overview - To Buy or Not to Buy,.... so it doesn't get buried.
Reflecting on the decision on whether to buy, progress on the Backlog is one key missing piece for me. The other is People, which I address in my last paragraph.
However, I wonder if I am holding out for too much. I agree that the SP is already at a solid discount to consensus and to the sector. The diversity of its segment exposures, its skew towards smaller projects, and track record would indicate to me that it should be more highly rated within the sector. So, I wonder how hard the SP will rebound on a positive Backlog update? Equally, is there much downside risk if the next update is poor or only moderate?
It comes down to whether I have enough faith in management to enter when things look less than rosey, rather than run with the crowd when it is plain to all that things are positive. A good management will turn things around, and this sector ebbs and flows.
I guess what is holding me back is my own lack of experience as an investor in this particular sector, and my experience-based bias against the largest engineering and construction contracting companies as attractive long-term investments. So perhaps the right strategy is add half the allocation now, and another half once the update is in - if its healthy. (I'm thinking in terms of a 3% RL allocation in total.)
The final piece of work I have to do before pulling the trigger is my review of people - just trawling LinkedIn and checking out holders of the key engineering and project management roles. How much of the talent base have been with $DUR for a while, and progressed through multiple positions, and how does it compare with the revolving door we usually see in the industry. If there's one common lesson I've seen in all the major projects I've reviewed over 30 years, its that 1) peformance is highly correlated to the quality of key engineering and project management roles, 2) high performance is sustained when teams roll from one project to the next, and 3) key position holders who have a track record of rotating quickly through key position roles in multiple firms is a red flag. If I can get comfortable that $DUR are differentiated in their people, then experience tells me that should be a "buy".
Rick
Nice addition as always @mikebrisy. I think the next big influence on the share price will be the guidance. We could expect this within a month and it should include an update on the order book. The market is already expecting a record year, but it’s the order book that everyone is worried about. You could wait until then if you wanted to reduce your risk for some.
edgescape
@Bear77 I haven't been happy with JLG performance either. Unless there is another competitor I'll stay for now.
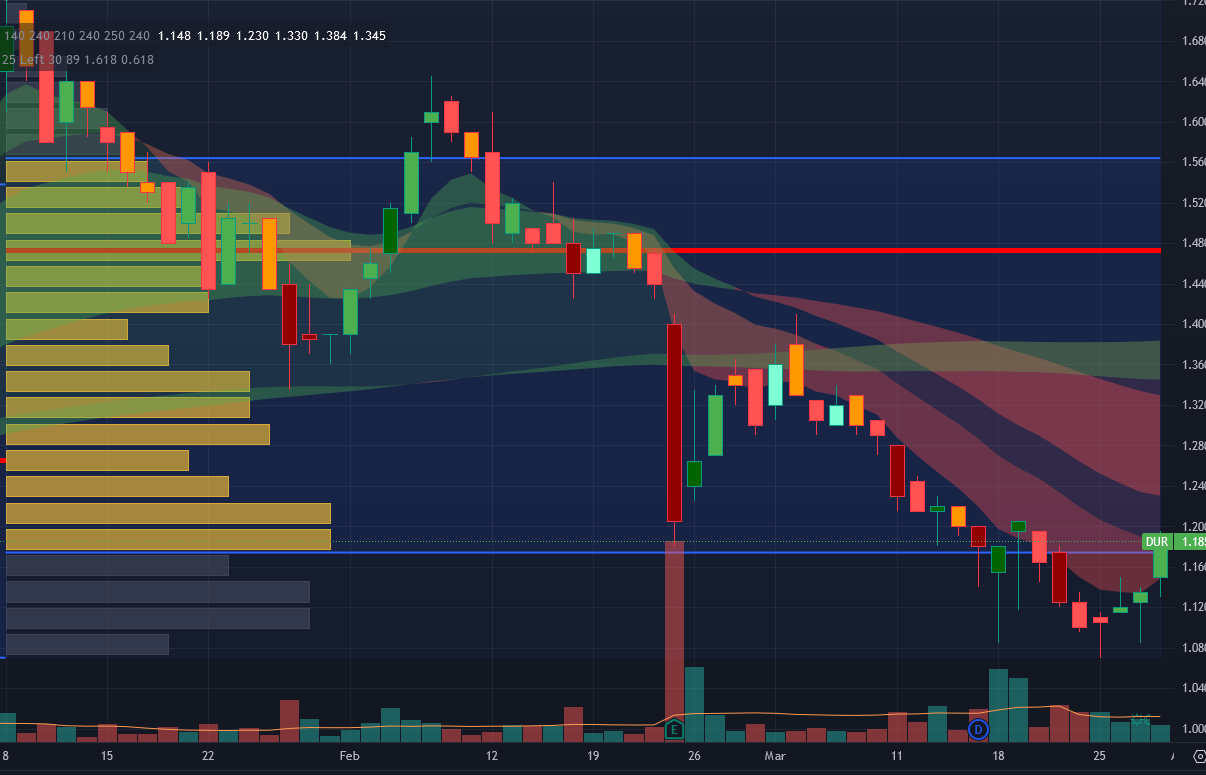
Meanwhile for DUR - thought I'd share this chart of volume profile which piqued my interest. Been watching for a while and dived in when it started going up to the blue zone recently.
Bear77
Interesting @edgescape - but I don't know how to read a chart like that - not my area of expertise really - but they do seem to have turned up at the end there if that's what you are referring to, which could be a positive indicator. It's been a strong downtrend over the past couple of months and I'd hate to think I'd broken my streak of investing well above the bottom and actually managed to almost time this DUR buy on Wednesday at below $1.14 reasonably well. That doesn't happen often. But it's very early days. One positive day doesn't make an uptrend - is what I'm telling myself to help contain my modicum of excitement. And it is well contained.
Regarding JLG, my original reason for not investing in them was their management, and the "other" interests of their CEO and MD Scott Didier, as well as the escrowed shares that hadn't been released yet at that time, and since then the release of the escrowed shares has NOT tanked their SP, and Didier's penchant for creating new businesses for his children to run (i.e. a "business empire"), and socialising with the East Coast's sporting elite, operating the Australian Nike distributing and retailing arm, and creating the ultimate "Man Cave" (bar) did NOT seem to hinder the company's growth and progress... I changed my mind and took the plunge last year, and got onboard the JLG train, however I was unimpressed with this last report from them for the reasons I have already shared, and I just figured that DUR looked better, so why not change horses mid-race to something that looks better? So I did. Made a small profit, picked up a dividend, and moved on. I'll keep an eye on them.
In terms of competitors, they do have competition, however their competitors aren't all listed companies, and JLG are the biggest LISTED player in their space here in Australia (and probably the only ASX-listed Aussie player, but highly unlikely to be the only stock-exchange-listed player in the USA - where JLG are now making some inroads).
Here's a link to the website of just one of their competitors here in Oz: https://www.disasterrestorations.com.au/about-us/ About Disaster Restorations Australia - Best Disaster Restoration Company
Home Website: https://www.disasterrestorations.com.au
Facebook: https://www.facebook.com/restorationsaus/
Insta: https://www.instagram.com/disasterrestorationaus/
And here's Scott:


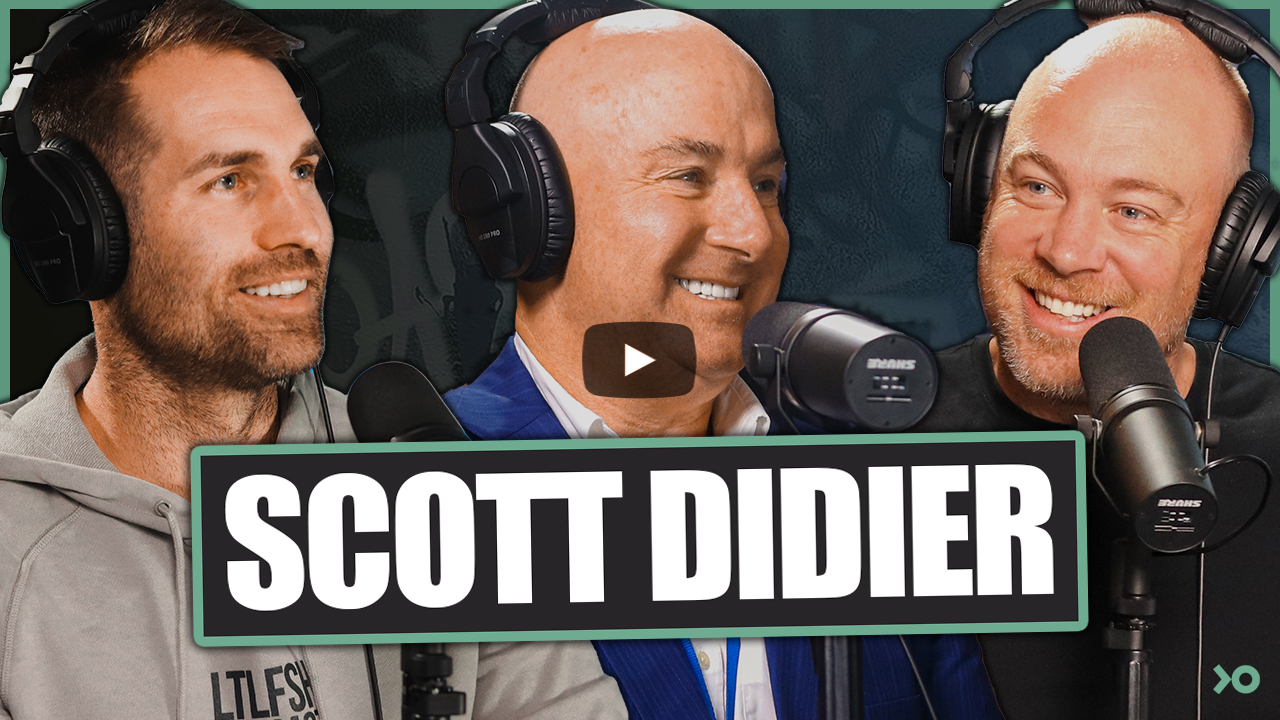
https://www.littlefishproperties.com.au/scott-little-fish-podcast-ep-7/ Scott Didier on How Rockstars Took His Business to 800 Million (littlefishproperties.com.au)


https://www.afr.com/companies/transport/how-a-rich-lister-s-10m-private-jet-deal-went-sour-20230517-p5d94m Private jet dispute between Rich Lister family and Johns Lyng CEO Scott Didier (afr.com)
Scott Didier has done very well, but this is Australia, and the "Tall Poppy Syndrome" is still very much alive and well, so I'm sure he expects and can handle the criticism. Those millions of dollars probably help with that.
Apologies to anybody who is pissed that we're talking about JLG in a DUR thread. Sorry. Won't do it again.
[Finger crossed behind my back.]
Karmast
@edgescape and @Bear77 I too owned JLG but exited recently on concerns over their ability to maintain the margin going forward, especially in the US. While I do think they can keep growing their topline, now that they are public all the insurers get to see their accounts. When they were private and then first listed 5 years ago the net margin was around 5%. In the last couple of years it's dropped down to between 3 and 4%. And even that is likely to be squeezed another percent or so, as the All States or Suncorps etc of the world look at it and negotiate a bit harder the next time the panel approval process comes up. I could be wrong of course but decided to look for a better opportunity elsewhere and avoid this likely risk.
edgescape
@Bear77 The yellow bars is Volume versus price feature to visualise supply and demand at certain prices. Similar to those supply and demand curves in economics. That feature tradingview is for premium users only. But some kind members have provided their own implementation so I'm using that for now.
It's obvious that competition will emerge and start impacting margins for JLG. The USA is the obvious example as there is already lots of companies there. I'm not ready to pull the sell trigger yet on JLG unless it hits my valuation.
I sold CUV instead to get here. It's obvious that I got "tricked" by the ROE and did not look more closely at management and execution. In addition, CUV has not started the buyback as promised on the 28th March.
Seems DUR ticks all the right boxes. In particular I like how they turned away some contracts which is a good sign they are not taking work for the sake of it.
mikebrisy
@Wini thanks for reminding us all about this data source. Therefore, I couldn't help doing a quick download.
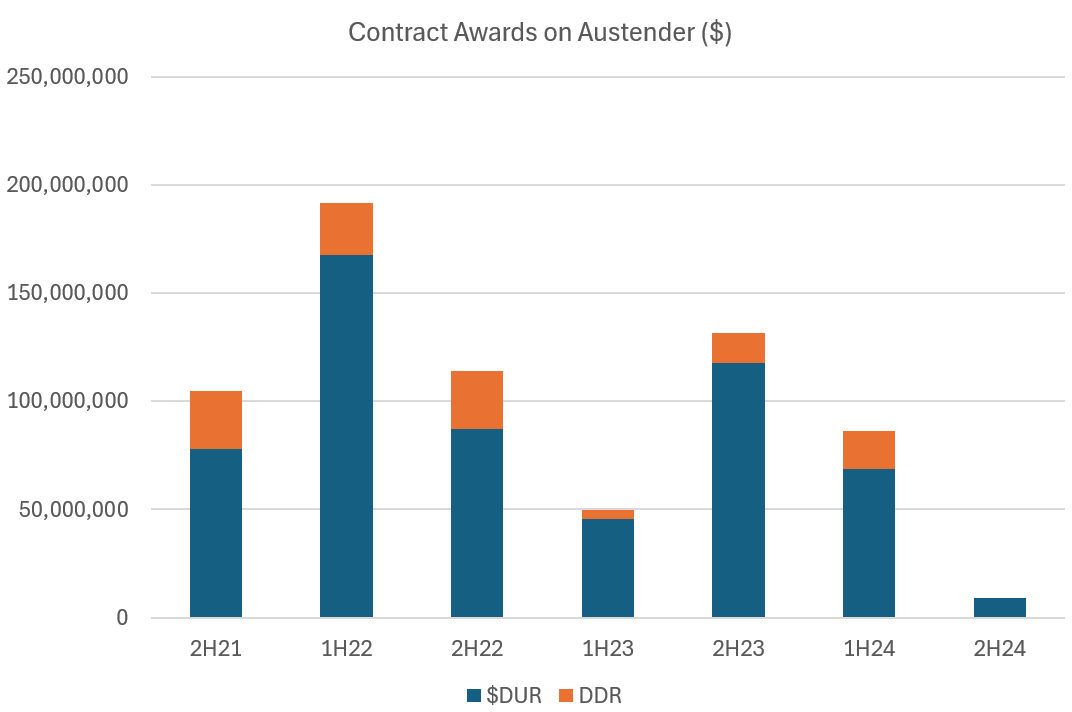
Public Sector contribution to $DUR pipeline is not looking so great,.... assuming I have pulled stuff off the portal correctly.
Do awards pick up before FY24 results? Do other sectors compensate?
At the last results, management said Parkes project ECI process is progressing well and is expected to be awarded in FY25. Austender is showing that to be estimated at $100-150m, so that would restore the Defence Backlog IF $DUR gets it, but appears unlikley to help FY24.
Management also said that Defence in 1H24 picked up. Yes, you can see that if you focus on PCP, but 9 months in, FY24 overall is looking anaemic overall.
I have no idea what the behaviour is with a budget period. For example, might there be a flurry of awards before the EOFY to lock in budgets? (However, I can't see this in the data for prior periods).
Update on my Investment Decision
Having seen weak signals on my people hypothesis (earlier straw), and the above picture on pipeline, I am going to sit on the sidelines until the update expected later this month.
Disc: Not Held

