


Wed 1st Oct 25
You may recall my last post on AIM. The chats were looking good for a set up with a divergence on the 1 day chart and other indicators also showing a positive signals. Fast foward, it looks like the signals were spot on. Its not always the case though. After reading eveyones thoughts however I decided to stay out for now (and I did agree with members thought).
Its alway a dilemma though. Do you follow the charts (market sentiment on the stock) or the fundamentals (ideally both). Im always trying to refine my investment methods. I have a number of positions (15-20K) currently that are well ahead (50%+) now and plan to loadup on their next draw downs all going well . I built these position without a reasonable positive narritve on the fundamentals, purely on chart technicals. Feels great now to have snagged a couple.
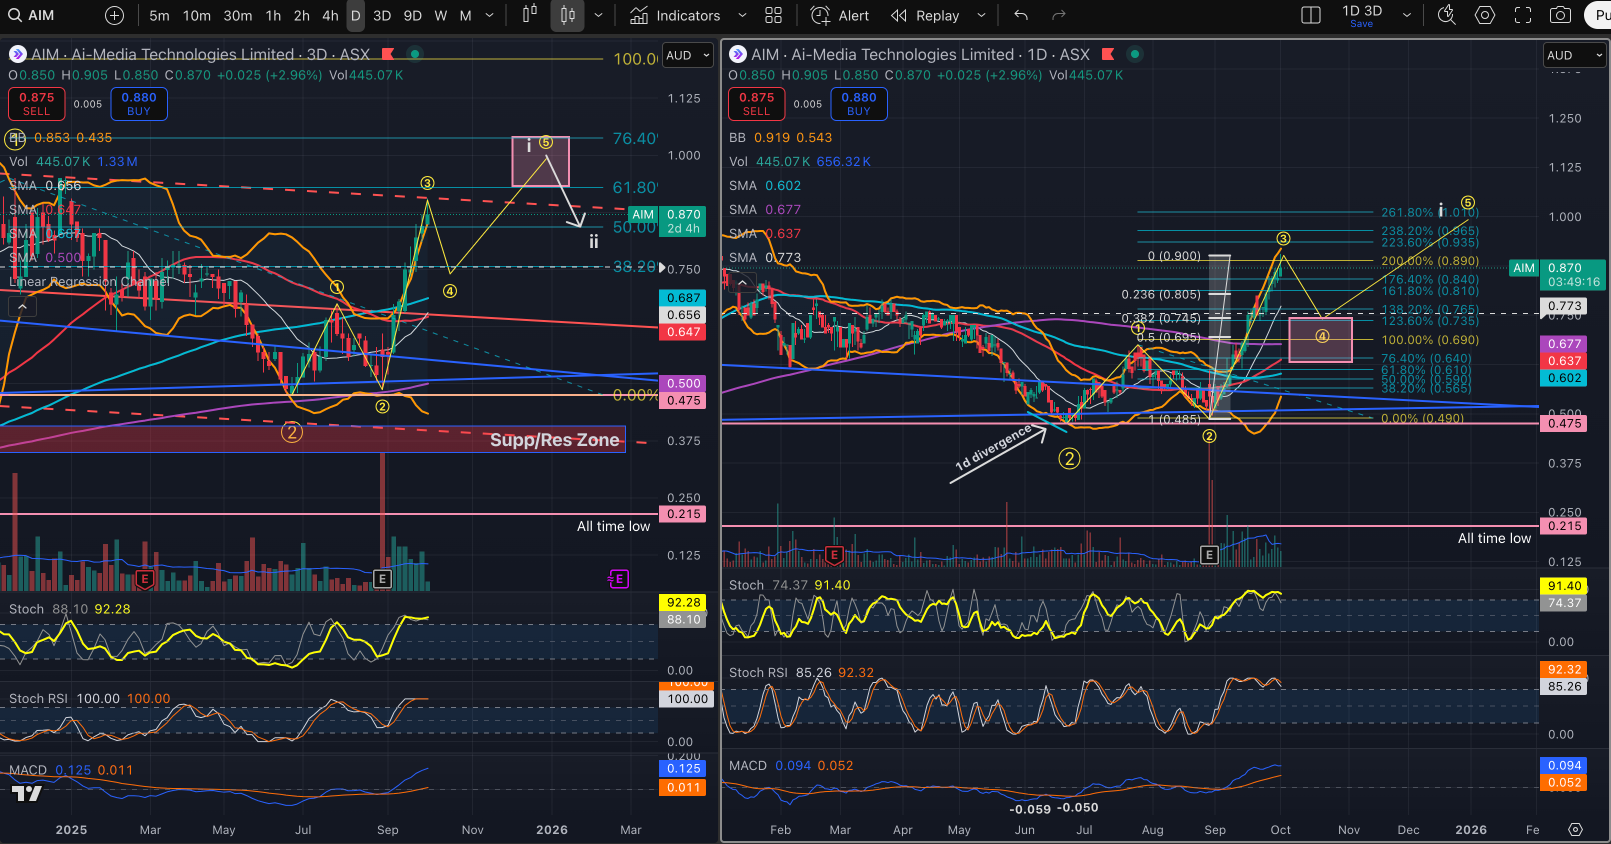
Looking back now at AIM, I feel I should have built up the same kind of position their. If i had gone ahead I would have started with 5k and increased leaving w2 on the 1d chart up another 5-10k by the time it was just breaking above the 200sma on the 1d. Currently the stock is working on the larger W(i) on the 3d chart. We should then see a pull back by 50% to approx 0.73 for W(ii). So long as their is now major news to the negative, I dont think it will drop that far. Many stocks seem to be only dropping to 23.6% or 38.2% of W(i).
Anyway for now I waiting until W(i) is finished and start to see the bottom of W(ii). That one can be tricky when the market is feeling bullish on a stock. Some times I have missed it and it has exploded up and never reached my target for getting in. Oh well there's always more opportunity’s get enter I let update you om my thoughts once we start to enter that kind of area
It looks like sentiment on this stock is very promising shown by the recent moves since the bottom. Im thinking that this could be another DRO. Lets hope so
25th July 25
 Tracking along nicly so far though looking forward to hearing everyone’s comments once figures are released. Im figuring, this climb as far as most are concerned here, would be in anticipation of better figures at this stage, right?
@occy So without reading you analysis I went ahead and charted it out. I hadn’t read your remarks completely as I didnt want my own obscured off the bat. Now i have read your commentry you can see the differences between them. Where it is right now on the charts, Im not seeing any direction to really enforce with any certainty which direction it will take so ill take with the worst case, thinking its got more to drop for now. You could actual say that From A up to B on the 1d is the start of the rise forming the wave1 up with the most recent low on the 5th March being wave 2 down, however the indicators aren’t providing my enough confidence so I will wait. As you may be aware, i like to wait for the 1/2 up and even the next i/ii after that along with improved Indicators.
