


This straw examines the performance of $LOV over recent years and considers how the business might evolve over the next decade, to form a basis for my valuation.
I’ve not been very reader-focused in writing it up, as it is more a download of the thought process I went through. So for those for whom life is too short, I’ll summarise the key messages below, and then for those who have developed their own valuations of $LOV and want to get into the details, I’ll leave it to you to wade through my brain dump (good luck!).
Key Messages
- $LOV along with most of the retail sector has rallied strongly over the last 6-months
- This has been driven by excessive market pessimism combined with operational outperformance by many, including $LOV
- $LOV is still early in its global rollout, having established clear and compelling unit economics
- The rate of the future rollout is a key unknown which drives uncertainty in the valuation
- $LOV has significant optionality in capital management including i) new store openings, ii) dividend policy and iii) capital structure.
Valuation
- $24.80 ($19.50 - $30.50) – at constant FY23 LT Debt of $65m
- $30 ($23 - $37) – capital structure with LT Debt of 0.5x EBITDA (“Levered Case”)
- To achieve a 10% Return in the Levered Case requires a SP of $18.50 ($14 - $23)
Conclusions:
- At the current SP of $31.65, I’m a HOLD on $LOV. While at the top end of the valuation range with the current capital structure, it represents reasonably fair value considering the balance sheet and growth optionality.
- I'm a Buy around $19 and a Sell above $36.
DETAILED NOTES and ANALYSIS
1. Retail Context
$LOV broadly reflects what has happened to the retail sector over the last 12 months. We saw a low point in market expectations around 6 months ago – when many were predicting a 2024 recession in US, EU and Australia, which would necessarily result in serious belt-tightening in discretionary categories.
While the results have indeed shown some slowdown, like-for-like (LFL) comparisons between the last quarter of calendar 2023 and trading updates in January and February have indicated the resilience of the consumer. With interest rate cuts anticipated in CY24, and job markets generally strong (albeit weakening), consumer confidence in US and Australia has picked up more recently. The EU area and UK – both in recession – remain in the doldrums. While global economies are not yet out of the woods, it appears increasingly likely that many areas will avoid recession and recessions, where they occur, will likely be shallow and short-lived.
So, with this macro backdrop, retailers headed through 2023 preparing for the worst. Many managed inventories tightly, continued to benefit from normalised supply chains, and managed costs of doing business as well as they could in an effort to minimise the negative operating leverage of their high fixed cost bases. Certainly, there were significant profit falls, but generally retailers performed better than expected. SP's have rebounded accordingly.
$LOV reflects this broad trend. Compared with FY23, when the P/E was 30.5x, after 1H, the forecast P/E for the FY24 has rocketed back up to 41 – near its highs in the last 24 months.
So, I am keen to understand what a reasonable range of valuations is for $LOV, at this point.
Lovisa is still at the early stages of a global roll-out. It now has a significant presence in ANZ, US and the EU/UK, but is in fact now present and growing on every continent and it in 40 countries.
It has proven compelling economics at the store level, and with strong free cash generation, a key question is at what rate will it continue to roll out new stores. This is clearly a perpetual question on the analysts’ minds – rightly so – and one which CEO Victor Herrero steadfastly refuses to give guidance on, sticking to the key message that they will open stores when they get good deals. Personally, I like this approach, as it has capital discipline written all over it. However, as my analysis shows, the uncertainty creates a wide range of potential outcomes for valuations.
2. The$LOV Global Rollout Under Way
I like to invest in companies that are building leadership in global markets (think $ALU(sniff), $RMD, $WTC, $PNV,…and yes $AD8 and $PME). So, part of my thesis is that $LOV is building a global brand and footprint in fashion jewellery and, provided it continues to execute, it has a very long runway ahead, even if the business is now relatively mature in ANZ. (Even my small home town in NZ with a population of <100,000 has a $LOV store!)
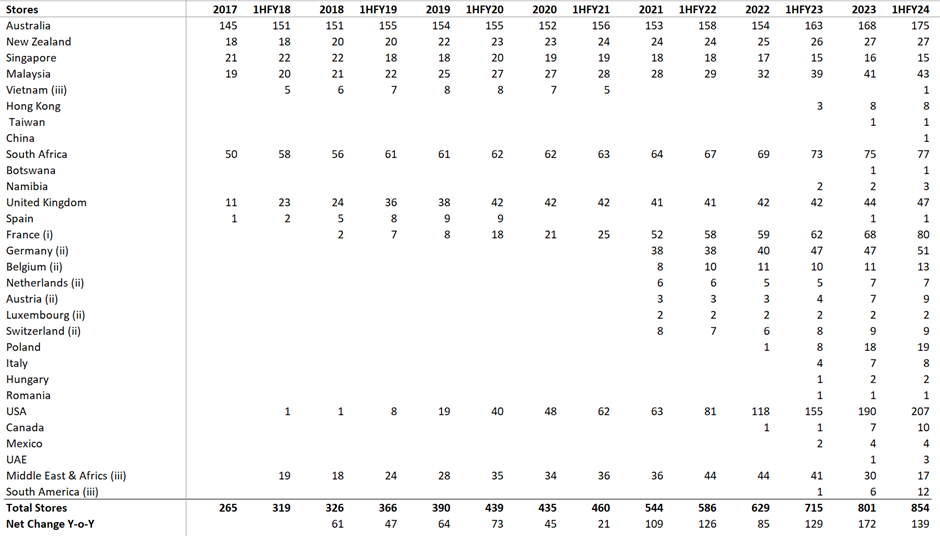
Table 1 below shows the evolution of the store footprint. The bottom row of the table shows the net annual change in stores. What this table doesn’t show is how actively the network is managed. Underperforming stores or even entire franchise agreements will be exited where necessary.
Considering the ANZ store footprint as indicative of a relatively mature market gives an indication of the potential ahead. For example, with 207 stores in the US today, the potential here could be 1500-2000 stores, double the size of all $LOV today. The same is true for the EU/UK region.
Table 1: Store Footprint
3. Revenue Growth Tells the Story of the Recent Retail Cycle
Next, I want to understand the historical story of revenue growth.
Figure 1 (below) shows annual sales growth by half-year increment, on both a like-for-like (LFL or comparable stores) basis and total revenue growth. The latter benefits from the significant new store opening programme of the company's global roll-out.
Figure 1: $LOV Annual Revenue Growth (%, Total and LFL)
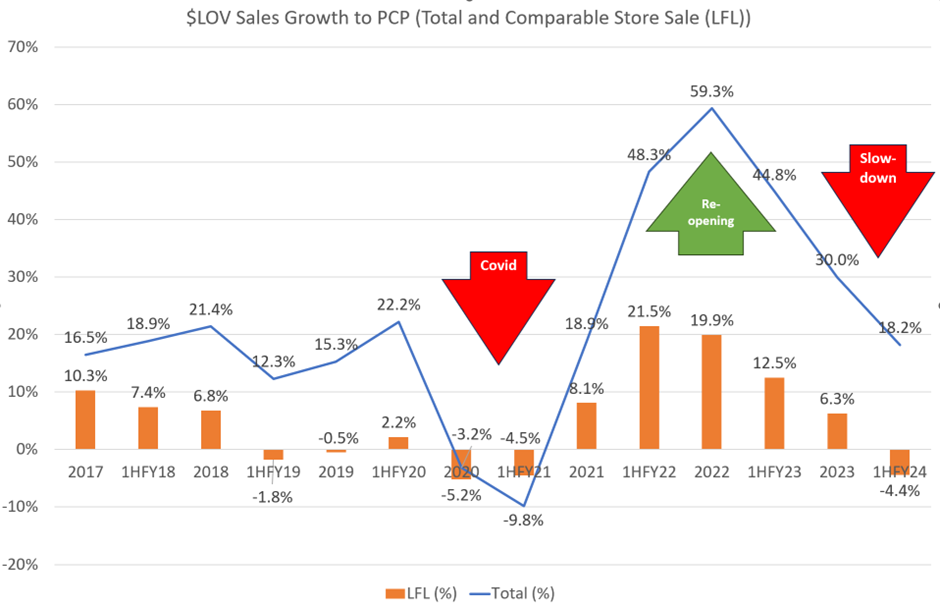
Source: Annual Reports
Consider first the LFL sales growth. Pre-pandemic, $LOV experienced a slowdown from 2017 into 2019. At that time, $LOV was dominated by ANZ, and I can’t see anything in the macro for clothing and accessories retail segment to support the companies claim at the time that macro factors could justify their claims of “cycling strong prior periods” and “tougher trading conditions”. In any event, strong new store grow meant that overall revenue growth was strong.
The pandemic dip in 2020 and sharp rebound in 2021 requires no explanation.
And the graph clearly shows the retail cyclical slowdown from 2023 into 2024, with modest single digit LFL growth falling into negative territory. On a volume basis, given inflation and pricing icnreases, the down turn is probably deeper. 2023 was probably flat, and 1H FY24 was probably closer to a LFL contraction of 6-8%.
So, in terms of future, long term modelling, I will consider LFL sales growth scenarios (in nominal $) of 2%, 3% and 4%.
At the low end (assuming long run inflation of 2.5%), this actually represents a scenario where same store sales decline in real terms, with the 3% representing broadly flat, real sales, and 4% a modest increase. Given the competition that will exist in this segment, I don’t consider it reasonable to consider higher growth scenarios, even though these have been achieved in the past, as I don’t see a case where strong brand value creates pricing power in this market. (I’m not a branding expert,… so I’d rather be conservative).
Now turning to total revenue growth, the difference between the orange bars and the blue line in Figure 1 is the global rollout of new stores.
4. Global Store Rollout
Key to understanding the value of $LOV is knowing the future pace and economics of the store rollout program. On the last two investor calls Victor Herrero was clear that the rollout trajectory is “not linear”, that they open stores when they can get a deal that works, and that each time they open a new market, a new set of “blue sky” awaits them.
So, what does history look like? Consider Figure 2, below.
Figure 2: $LOV Store Roll-Out (Annual Net Change in # Stores; and % Change from PCP)
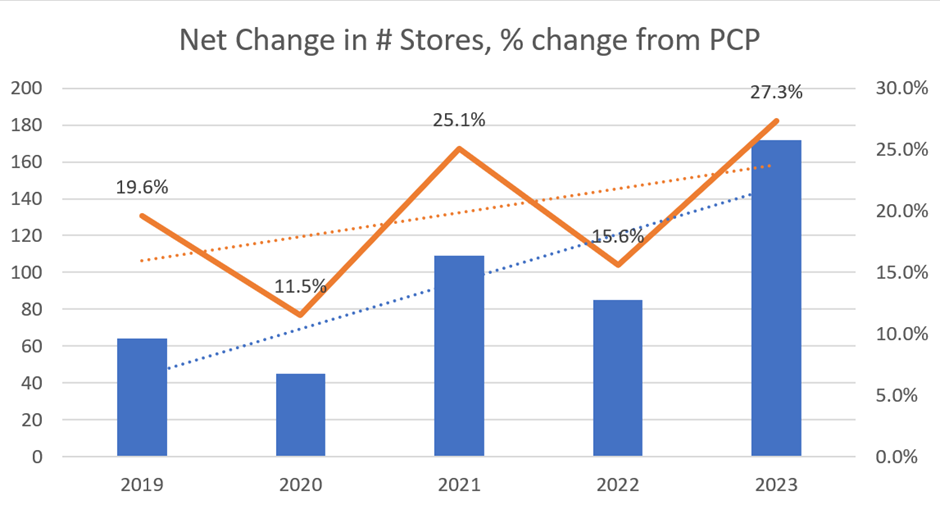
Source: Annual Reports
$LOV appears to not be driven by a pre-determined target of number of new store openings.
The drop in 2020 is easily understood due to the pandemic restrictions impacting 2020. In fact, the net store increase masks a larger number of closures, no doubt due to the pandemic.
2021 can be explained by the pent-up demand following re-opening, as well as (potentially) a brief window when good deals could be struck with shopping mall owners seeking to repair their balance sheets and attract quality tennants.
So, with the backlog of 2021 out of the way, 2022 probably reflects a return to something like BAU, which then makes 2023 a surprise with a massive step up in new stores, which drove revenue and SP.
So, what of 2024?
Well, 1H has seen only 54 net store openings, with an even slower start to 2H. It seems likely that FY24 will end up with somewhere between 80 and 100 new stores – back around 2022 levels. There were no capital constraints to store opening in 1H FY24, because $LOV paid down $22m of its $65m long term debt, finishing the year with $58m cash, up from $50m 6 months earlier.
Perhaps the conservative approach is prudent given high interest rates and continuing marco-uncertainty, with the EU and other markets in now squarely in recession, Australia in a per capita recession, and the US being somewhat the exception in the OECD group.
Based on the current operating economics, $LOV has the capacity to take on more debt, increase the rate of store buildout AND modestly increase the dividend. So, Victor has a lot of levers at his disposal. (The fact that Victor won’t provide forward indications as to the rate of store openings is clearly driving some of the analysts nuts.)
Next, we have to understand store level economics.
On the recent 1H call, Victor said in Q&A that the best way to figure out the cost of opening a store is to get it from the capex and number of stores, recognising the following:
· Australia or South Africa about $0.15m per store
· US “about double that”, so $0.30m
· Cheaper markets “a bit less”, so assume $0.1m per store
Having looked at the accounts for 2022 and 2023, I get higher numbers of around $0.4m per store. So, what is driving the difference? In calculating a Net Change in Stores, I am blending several factors which all impact the investing cashflow (capex) line:
· New store openings;
· Store closures (there were 31 in FY23 and 19 in FY22);
· Acquired stores; and
· A reduction to capex from contributions from Owners to fitouts. When Lovisa takes on a lease and fits out a shop, some of the investment improves the store beyond the life of the lease, so the landlord makes a contribution to the fitout.
So, this explains why a simplified Capex per net new store results in a higher figure than those indicated by management, and it allows me to keep the model simple.
Because the market potential is large, and we cannot know the rollout rate, I’ll run three scenarios:
· Low Case: 100 net new store per year
· Mid Case: 135 net new stores per year
· High Case: 165 net new stores per year
I’ve chosen a fixed number per year rather than a % number to reflect that as the rollout continues, while the company will have progressively higher financial capacity to open more stores, countering this it will become progressively harder to find good deals in each market (law of diminishing returns).
The analysis is conservative because, in the high case, we are simply repeating a level of store openings already experienced in 2023. Total stores across the three scenarios considered are shown in Figure 3.
Figure 3: Number of Stores – 3 modelling Scenarios
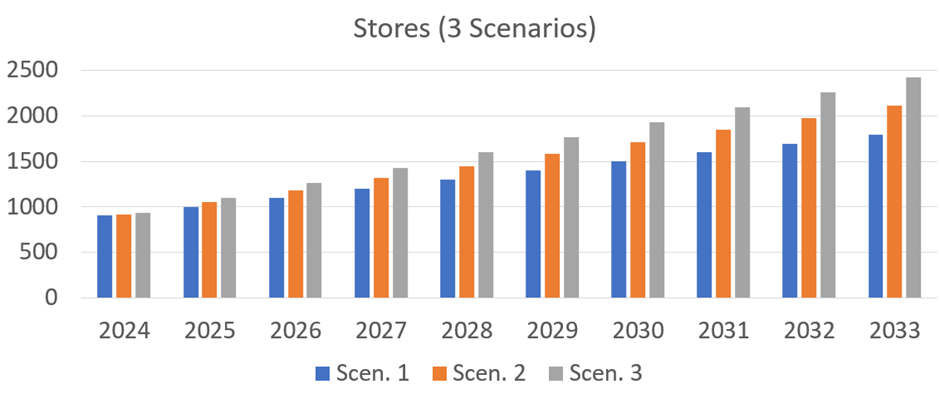
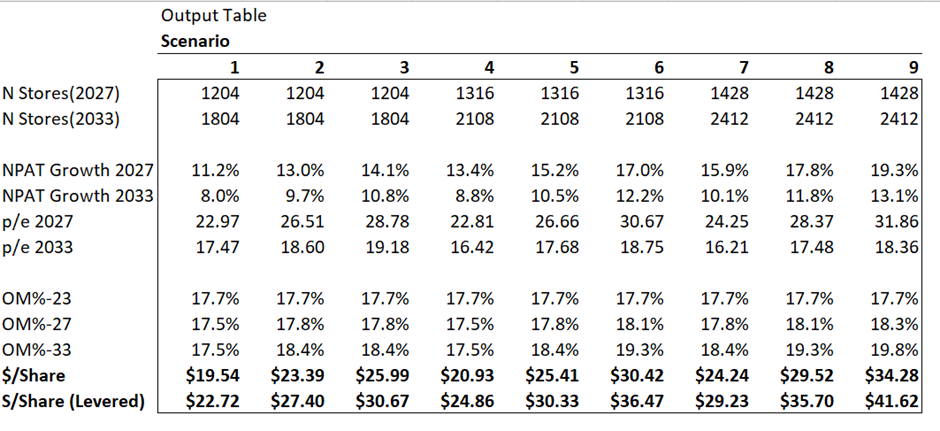
In the scenarios contemplated, the 2033 store counts are 1804, 2108, and 2412, given a 1H FY24 count of 854, so a two to three-fold increase.
This is in the context of a global roll-out already underway where the US at 207 stores is arguably 10%-20% penetrated, and the EU/UK at 249 is at a similar level. Based on these scenarios, there will plenty of growth potential beyond 2033 (if the brand remains relevant and if the competitive landscape allows!)
These projections Also seem reasonable for global retail brands. Retailer H&M grew its global physical store network from 550 in 1998 to a peak of 4,500 in 2019. If anything, subject to financial capacity constraints, my Scenario 3 could be considered modest, because opening what is a relatively small Lovisa boutique is arguably a less ambitious undertaking than an entire H&M store.
4. Margin Evolution
Gross Margin
Pre-COVID, $LOV achieved gross margins of 80%. (That’s pretty impressive, when compared with $SUL at 47% and $NCK at 63%.) While gross margins dipped through COVID, they have most recently been restored to 79.9% at FY23, and even 80.7% in FY24. To keep things simple, I assume %GM is maintained at 80% in all scenarios.
I’ve done this partly because I don’t understand the potential impact of i) increasing scale, driving future economics of scale in manufacturing, offset by ii) a potential increasing proportion of stores in locations where prices may be lower (e.g., middle income countries). Having said that, my modest store growth scenarios could be achieved in the high value markets of the US and EU/UK alone, however, it is clear that $LOV are truly going global!
Cost of Doing Business
While the store level expenses are directly scalable, as the network of stores scales in any country or region, there will be efficiencies in a) distribution, b) regional overheads and c) e-commerce.
On e-ecommerce, I have not modelled this separately. $LOV has an online offering in each of it’s markets, however, it has not been particularly transparent in breaking out the key value drivers. This is a limitation in the model. If $LOV achieves increased brand recognition and ability to move loyal customers online, this will result in the lower cost of doing business and increased margin potential.
Figure 4 shows the Cost of Doing Business, which I have calculated as:
= Salaries and employee benefits expense + Property Expense + Distribution Costs + Other Expenses.
Figure 4: Cost of Doing Business
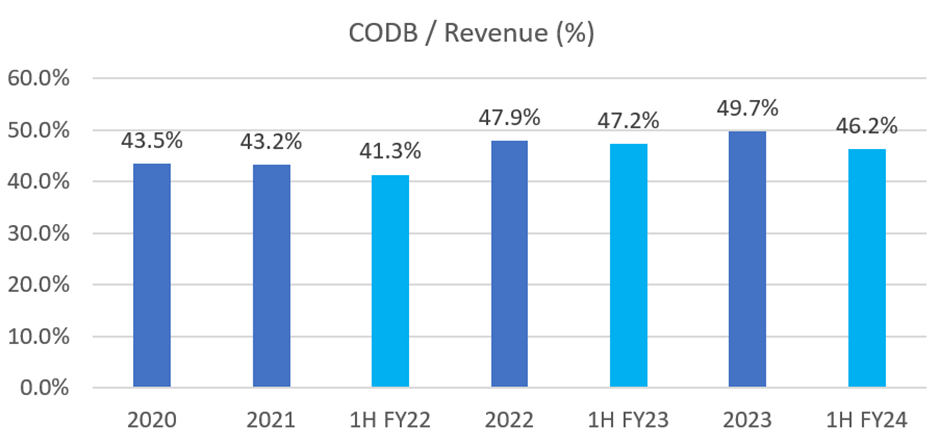
CODB as a % of revenue increased significantly during 2022 and 2023. However, judging by the comparison of 1H FY24 to 1H FY23, the result for FY24 appears to be stabilising.
What can explain this trend? There are three factors:
- First, we should ignore the results for FY20 and FY21, as these will have been impacted by various closures, restrictions, and subsidies during the pandemic.
- FY23 also saw a record number of new store openings. So, this is likely to result in a period where stores incur their full operating cost during a period when store sales are ramping up. As the network scales, this effect will become proportionately less important over time.
- FY22 saw higher distribution costs and FY23 was a period of peak inflation.
For future periods, I therefore assume that CODB/Revenue is maintained at FY22 levels. The modelling assumption is described fully in the next section on Operating Margins.
Operating Margins (OM)
%OM was 18.0% in FY22 and 17.7% in FY23. Margins appear to have stabilised in FY24, with 1H FY24 at 21.9% compared with 1H FY23 at 22.2%. (Note: 1H %OM is significantly higher than 2H due to the stronger 1H revenues)
Over time, as the store network continues to expand there should be economies of scale in the distribution network. For example, the distribution infrastructure for US, EU/UK and ANZ is now largely in place. Further buildout of the stores within these regions should enjoy lower incremental distribution costs.
What is less clear is how the CODB and margins scales as the mix of stores across regions evolves. For now, it is assumed that US, EU/UK and ANZ will continue to contribute the large majority of stores. This assumption could be changes in future, for example, if there was a major build-out of the network in China. However, this seems unlikely to change the overall assumption given the prior progress of Western retailers in China, who generally have not built out networks beyond about 200 stores (e.g. Carrefour).
Model Scenarios - Operating Margins
Going forward, my model assumes FY24 %OM will be 17.5%, with scenarios as follows:
- Flat %OM = 17.5% from 2024-2033;
- 0.1% p.a. margin improvement reaching 18.4% in 2033;
- 0.2% and 0.25% p.a. margin improvement in the high-store buildout scenarios, reaching a %OM of 19.8% in 2033, in the highest case.
5. Capital Structure
In running the valuations, I have run all 9 scenarios across three cases:
- WACC = 7.9% with constant LT debt at $65 million (calculated off the current balance sheet with cost of equity of 9.5% and cost of debt of 6.0% - applied to both debt and leases)
- Increase LT debt to maintain a constant leverage of 0.5 x EBITDA (this drives significant FCF generation while still maintaining a conservative balance sheet. For example, this is approximately the level of debt at $JBH)
- I’ve also modelled a 10% discount rate, to show the SP required to deliver that investment return.
6. Continuing Value
Across the scenarios modelled, by 2033 $LOV will have established a global network of between 1804 and 2412 stores, compared with the 854 at the end of 1H FY24.
2033 need by no means represent “Peak Lovisa”. For example, Zara reportedly has around 3,000 stores worldwide, and H&M has between 4000 and 5000.
Therefore, assuming annual market growth of 2.5%, I assume ongoing growth in Free Cash Flow in the continuing value period of 4.0% p.a. achieved through any combination of i) network growth, ii) brand value improvement, iii) operating efficiencies, and iv) increasing contribution over time from stores in middle income countries.
7. Key Risks
Some key risks are not considered in my valuation model:
- “Peak Lovisa” is reached beore 2033 or shortly thereafter, due to a global shift away from fast-fashion, costume jewellery.
- Growing competition – others seek to replicate Lovisa’s model. (We have seen this before in fashion as Zara’s disruptive business model was replicated over time.)
Either risk materialising would see a slowing of network expansion, followed by pressure on margins, over time. Emergence of these risk would likely see a rapid contraction in the earnings multiple, back into the pack of retail more generally. (P/E of 12%-15%).
Note that in the current model, the implied P/E at 2033 ranges from 17.6x to 19.3x – so my valuation assumes that $LOV retains its growth premium over the retail sector for the next decade.
8. Valuation
Figure 5 shows the NPAT over the 10-year period across the 9 scenarios. The scenarios spanned the ranges of the parameters shown in the blue box.
Figure 5: NPAT Evolution Across Scenarios
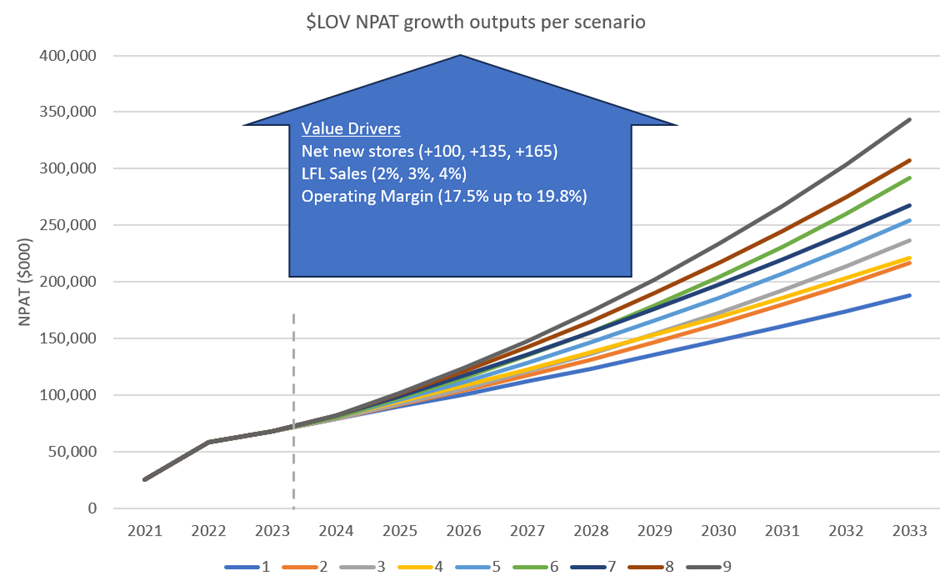
Figure 6 shows the resulting valuations, with the red lines reading off the mean, p10%, and p90% valuations for the valuations run at constant LT debt ($65m) and WACC of 7.9%.
The light grey line shows the valuations run with LT debt increased each year to a level of 0.5 x EBITDA.
The orange dotted line shows the SP required to achieve a Rate of Return of 10% in the Levered case.
Figure 6: Valuation Results
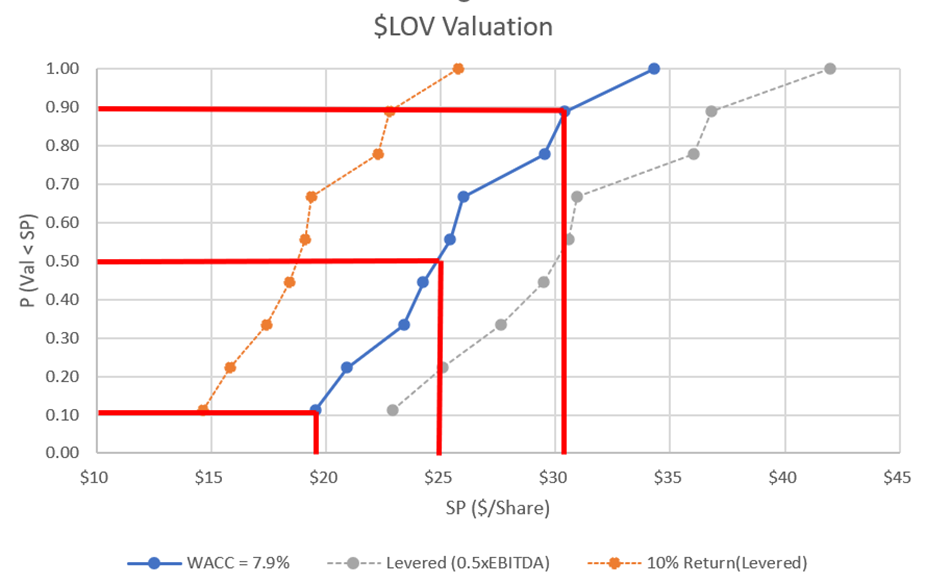
Table 2 below provides some more of the modelling puts, including earning growth rate, margins and implied P/Es over time.
Disclaimer: The analysis has been performed for my personal use and should not be used as the basis for investment decisions. Model calculations and outputs are not validated to be free from error.
Disc, Held in RL and SM
$LOV issued a trading update for the first 20W of FY24 at the AGM this morning.
I've tracked this update (highlighted) against the recent updates it has issued, to show the anatomy of the slowdown it is facing. The trend is very clear.

Given that the last result probably includes something like 5-6% inflation, this indicates that same store volumes are down well over 10% from their peak.
With only 6 weeks trading to year end, the next 6 weeks are the peak retail period, so the 20 week update gives a good reference to see how well they fare through to year end.
In addtion, $LOV have open 55 new stores YTD and closed 20 for 35 net new stores (which includes the UAE franchise conversion to company owned, which is 12 store). Compared to a year ago, $LOV are currently trading in 160 more stores and 14 addtional markets, for a total of 836 stores. So network growth continues, albeit at a moderating pace to last year.
The market seems OK with the update, with SP up around 2% at time of writing.
I'm still looking increase my $LOV holding. The slowdown is continuing and it will be interesting to see how the business fares through the key November-December period. My view is that we might not yet have seen the bottom, so I will hold off with adding more.
Disc: Held in RL (2%) and SM