Charts look a lot better now
Yesterdays big sell off corrected all the issues I had with the charts. Obviously now you probably all realise I need all the lines in my Stochastic indicator to be heading in the same general direction and keeping relative pace with each other across all 3 time frames (1D, 3D, 9D). You will note however that across all time frames they are still pointing down as well as the MacD (next indicator below with lines changing from red to green etc) also pointing down. In my last post I mentioned I thought it would drop to 3.18 (Tick) and possibly further down to 3.00 (Tick). The next targets are 2.83 (Yellow rising T.Line) - 2.77 ($ Support). Will it go straight there? no probably not. It will probably correct after last couple of trading days for a wave up (as my blue arrows show on the 1D) however following @Rocket6 analysis which I feel to be on the money, NAN still trades at lofty multiples. On that note, Im still holding out for further declines as market sentiment medium term is terrible. If one was to trade in after days like yesterday then be aware it should only be for the short term trade (make a little coin) and leave again. Yes I feel it will go down to the Yellow T.Line Support of 2.83, however as @Rocket6 said, the multiples are still looking inflated so NAN definatly could see lower $. We all try to time the bottom regardless if we say we arent, thats what we wish for. I think it will bottom and go side ways for a while within a range before we see some kind of medium term bullishness appear. Idealy you would want to see the 3D chart indicators turning up before participate in a decent upswing. If your really conservative, you would wait to see the 9D turning up.
So Here's how the charts look now after the recent drop

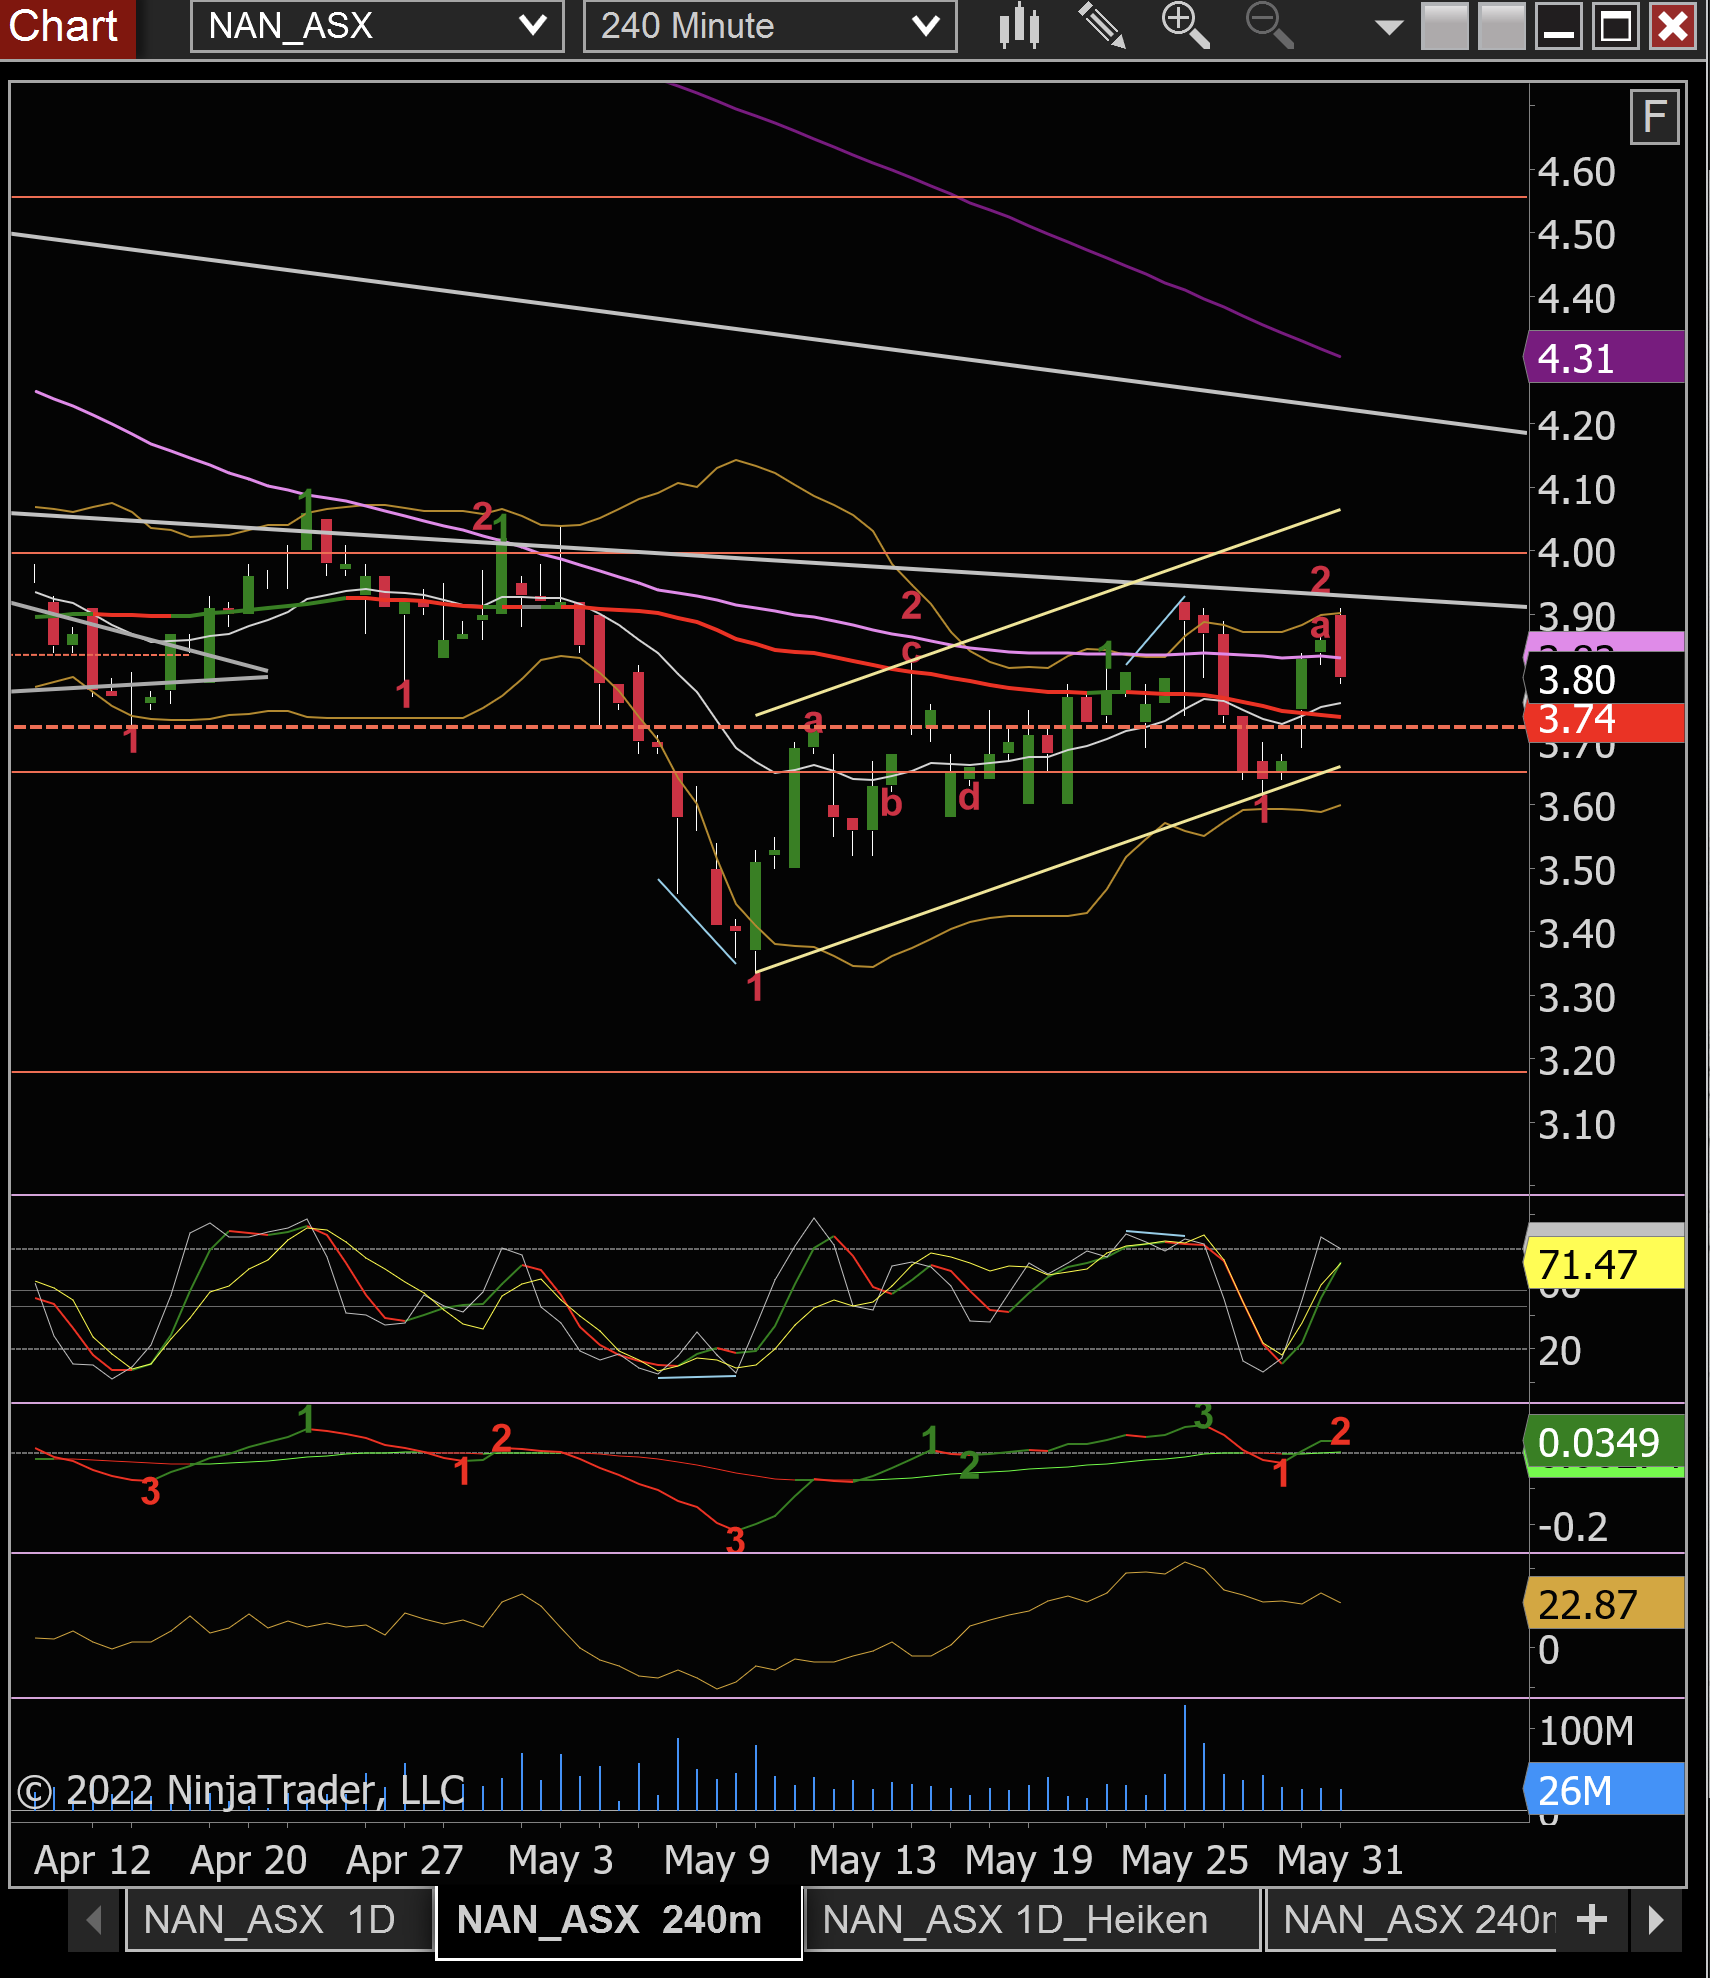
and the 4hr below.

I beleive its still got a way to drop yet.
I thought some may like to see an update on the chart Analysis from my post recently. As you can see on the 9D its still ahead of itself even after the recent drop I forcasted in my past post, has been confirmed. So it dropped to test the recent bottom it made approx 3 weeks ago on the 1D and has stalled there. It is re-testing that bottom as I write this post.

Below in the 4hr chart, you can see the Yellow long term indicator is still declining (denoted by the yellow 6.32) with the white indicator (Current action) chasing it down. My thoughts are it will probably go down to at least the next Support level approx $3.18. Once there I will re evaluate. I have a bad feeling though it may drop as far as ?a ($3 ish) or ?b ($2.85 -2.90 ish) as shown on the 1D chart above. FYI the Yellow Line on the Chart is the historic Trend Line from way back. When it gets within ear shot of it, it usually goes all the way to it to test it out. I dont think we are close enough yet to test that one though who knows. I see the only thing to turn this around would be a great end FY22 report.

I will keep you posted if something changes my mind and results in myself taking a position in NAN.
Sorry for any spelling or Grammer mistakes. Short on time today.
Be careful, I see weekness. I have noticed over the last month many Starclub members buying nanosonics. I have held out buying in even though it has had a run up of its most recent bottom of $3.37 bottom as my charts tell. You will note that on its recent high (on the 25th May, high volume day) off the so called bottom, it hit 2 of my resistance trend lines and failed to push above. It has since come back a couple of days later to test those same 2 resistance T.Lines and so far today failed again on weak volume (making a possible double top pattern).
The reason I have stayed out was due to its weak volume on the Daily chart and also you will note by the 9day Chart on the far left, its indicator line (the white one) in the Yellow highlighted circle is way ahead of its long term indicator line (the Yellow line, also in the Yellow highlighted circle) . When this happens it tends to revert back towards the Yellow which currently has only kicked up a little and hasnt gained as much pace as I would like to see.
Three things can happen here obviously. 1st_price action could now go side ways for some time in a range until the longer term Yellow line catches up some what (not likely though possible until this finacial years result come out to verify direction), 2nd it could retrace towards its yellow longer term line (I think this is the most probable according to my chart analysis) and 3rd it may drop to the recent Support line (the red dotted line on the daily) bounce of and continue on its way up slowly with volatility until the result for the year come out and then who knows what. For me, Im taking the second scenario, however I cant stress enough make your own decisions.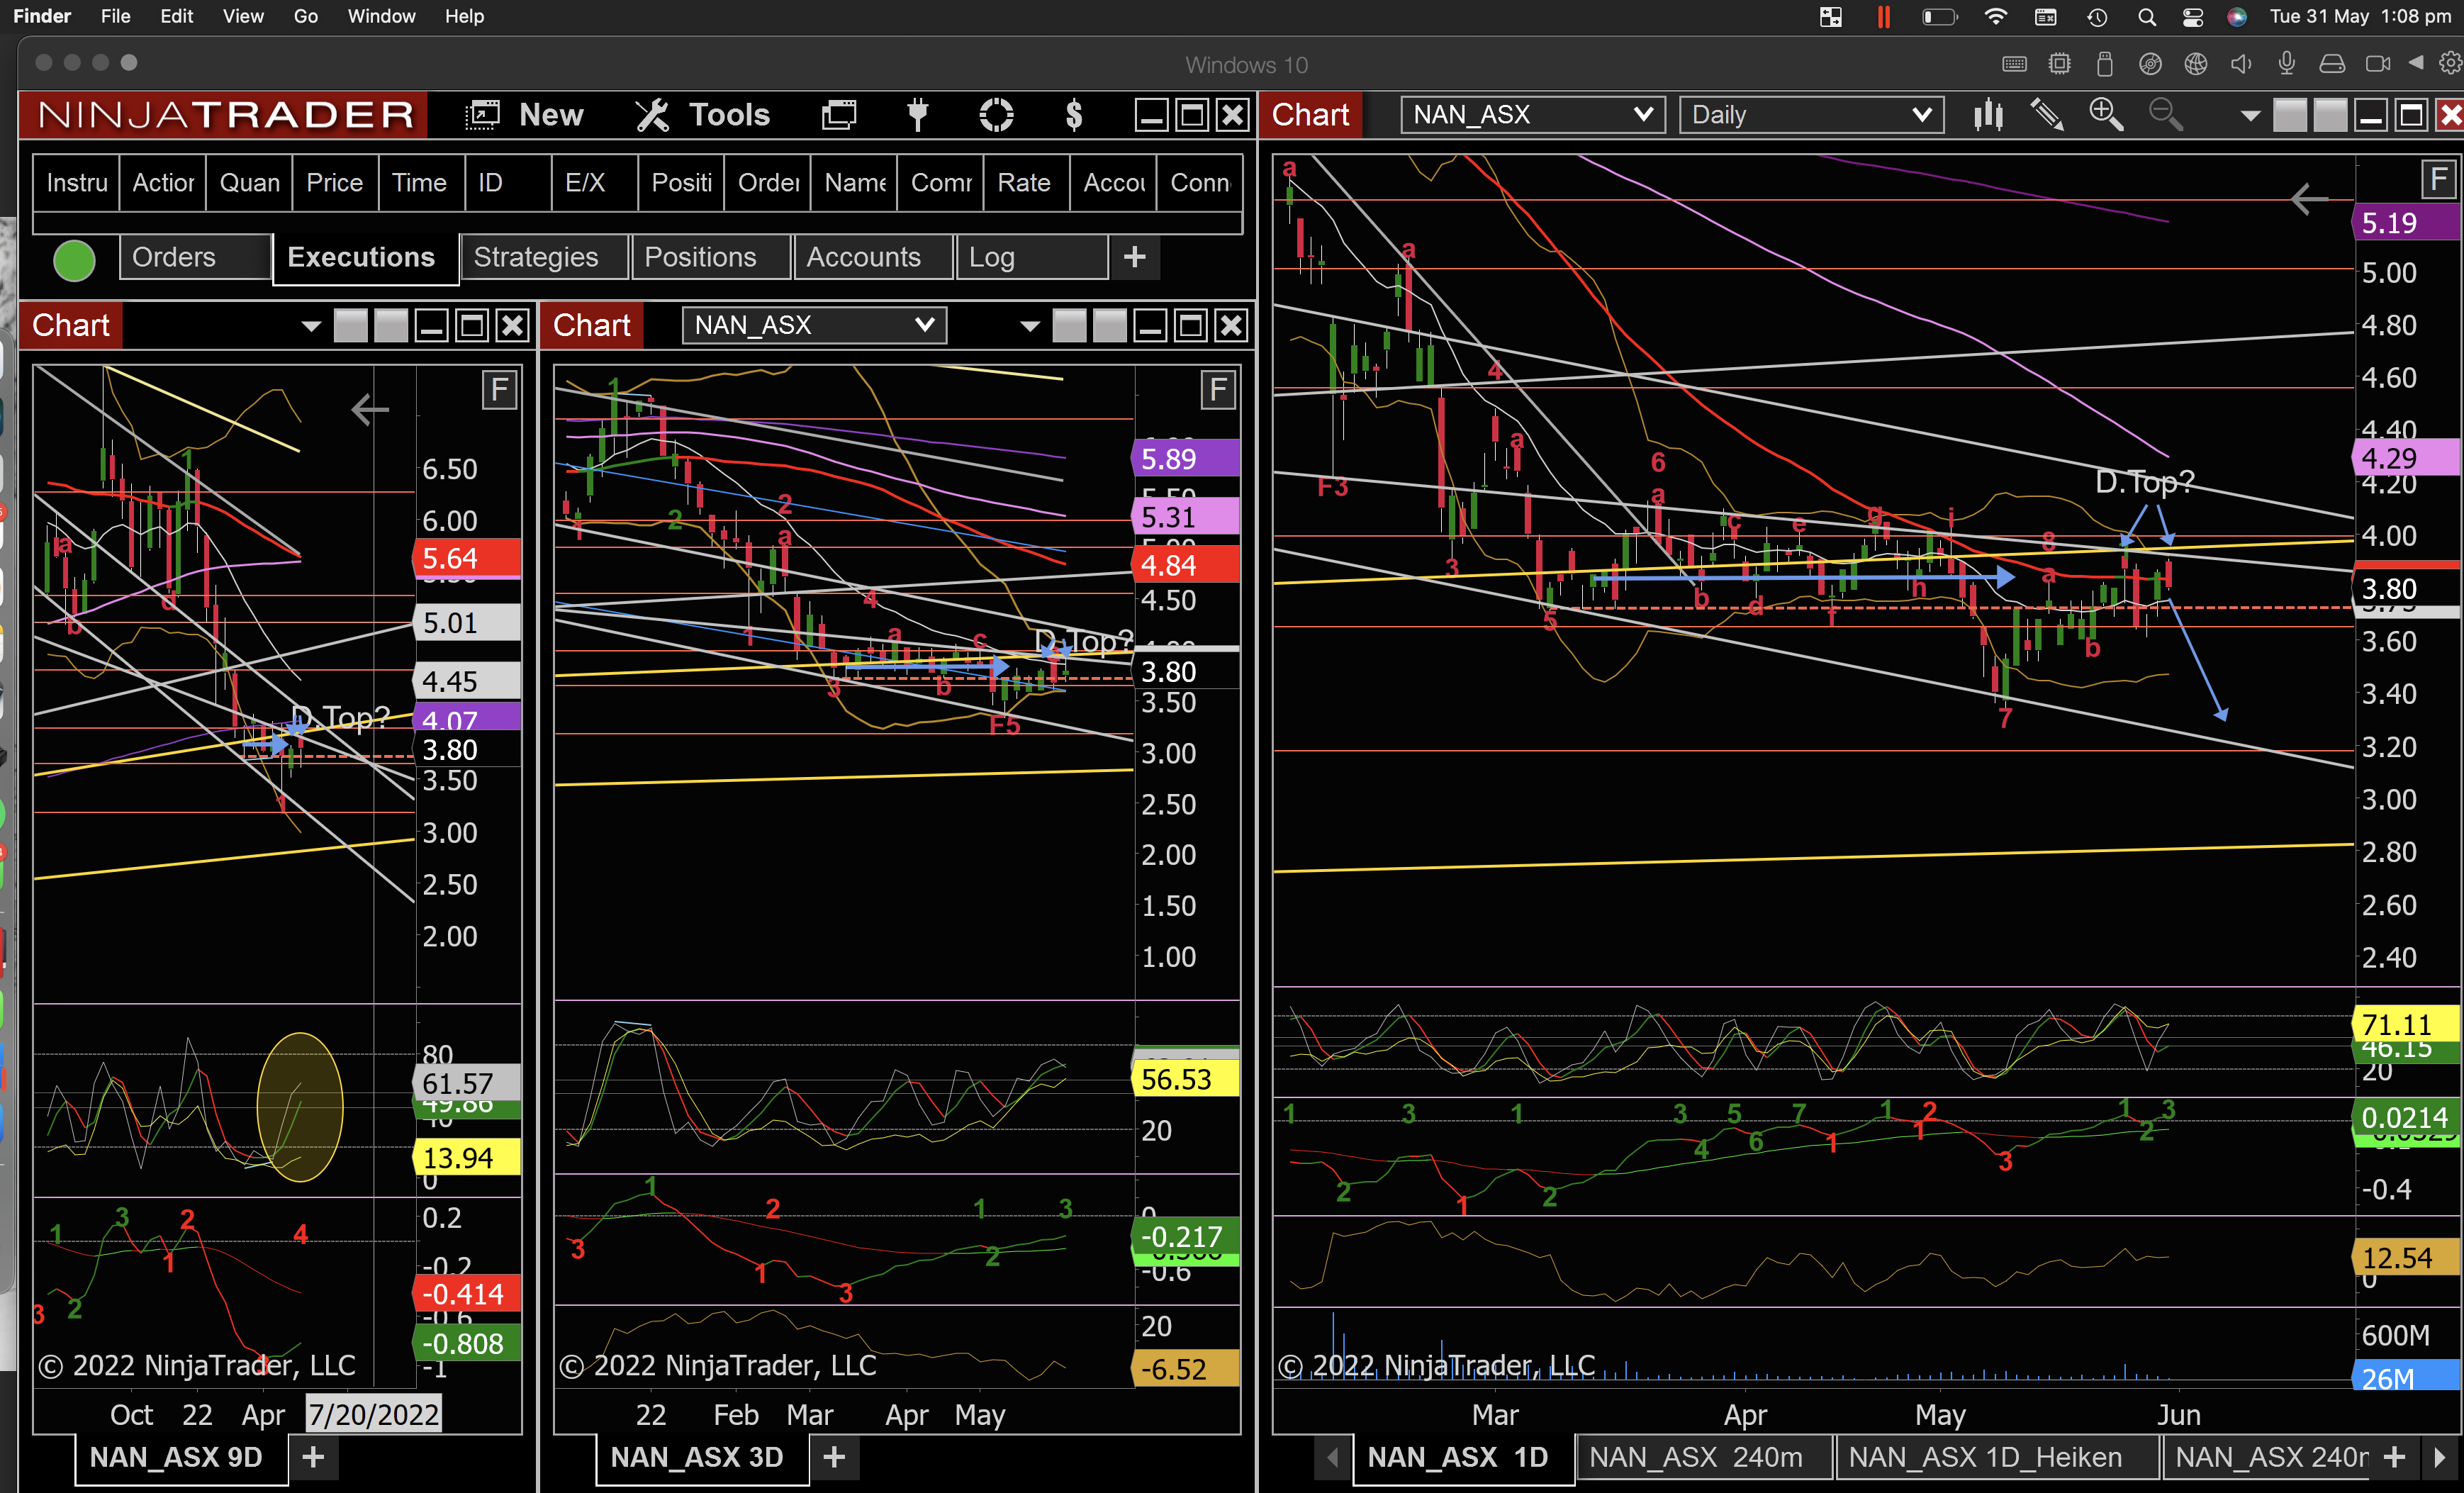
Below in 240m chart it is also showing a change in direction. Stochastic curling over, momentum indcator is week and chaikin money flow is pointing down or weakening. The $3.69 - $3.74 support and the 50DMA & 15DMA is going to be critical. If it breaks below this range, Look out. Hopefully this all helps with your current thoughts and actions or maybe just creates more confusion.