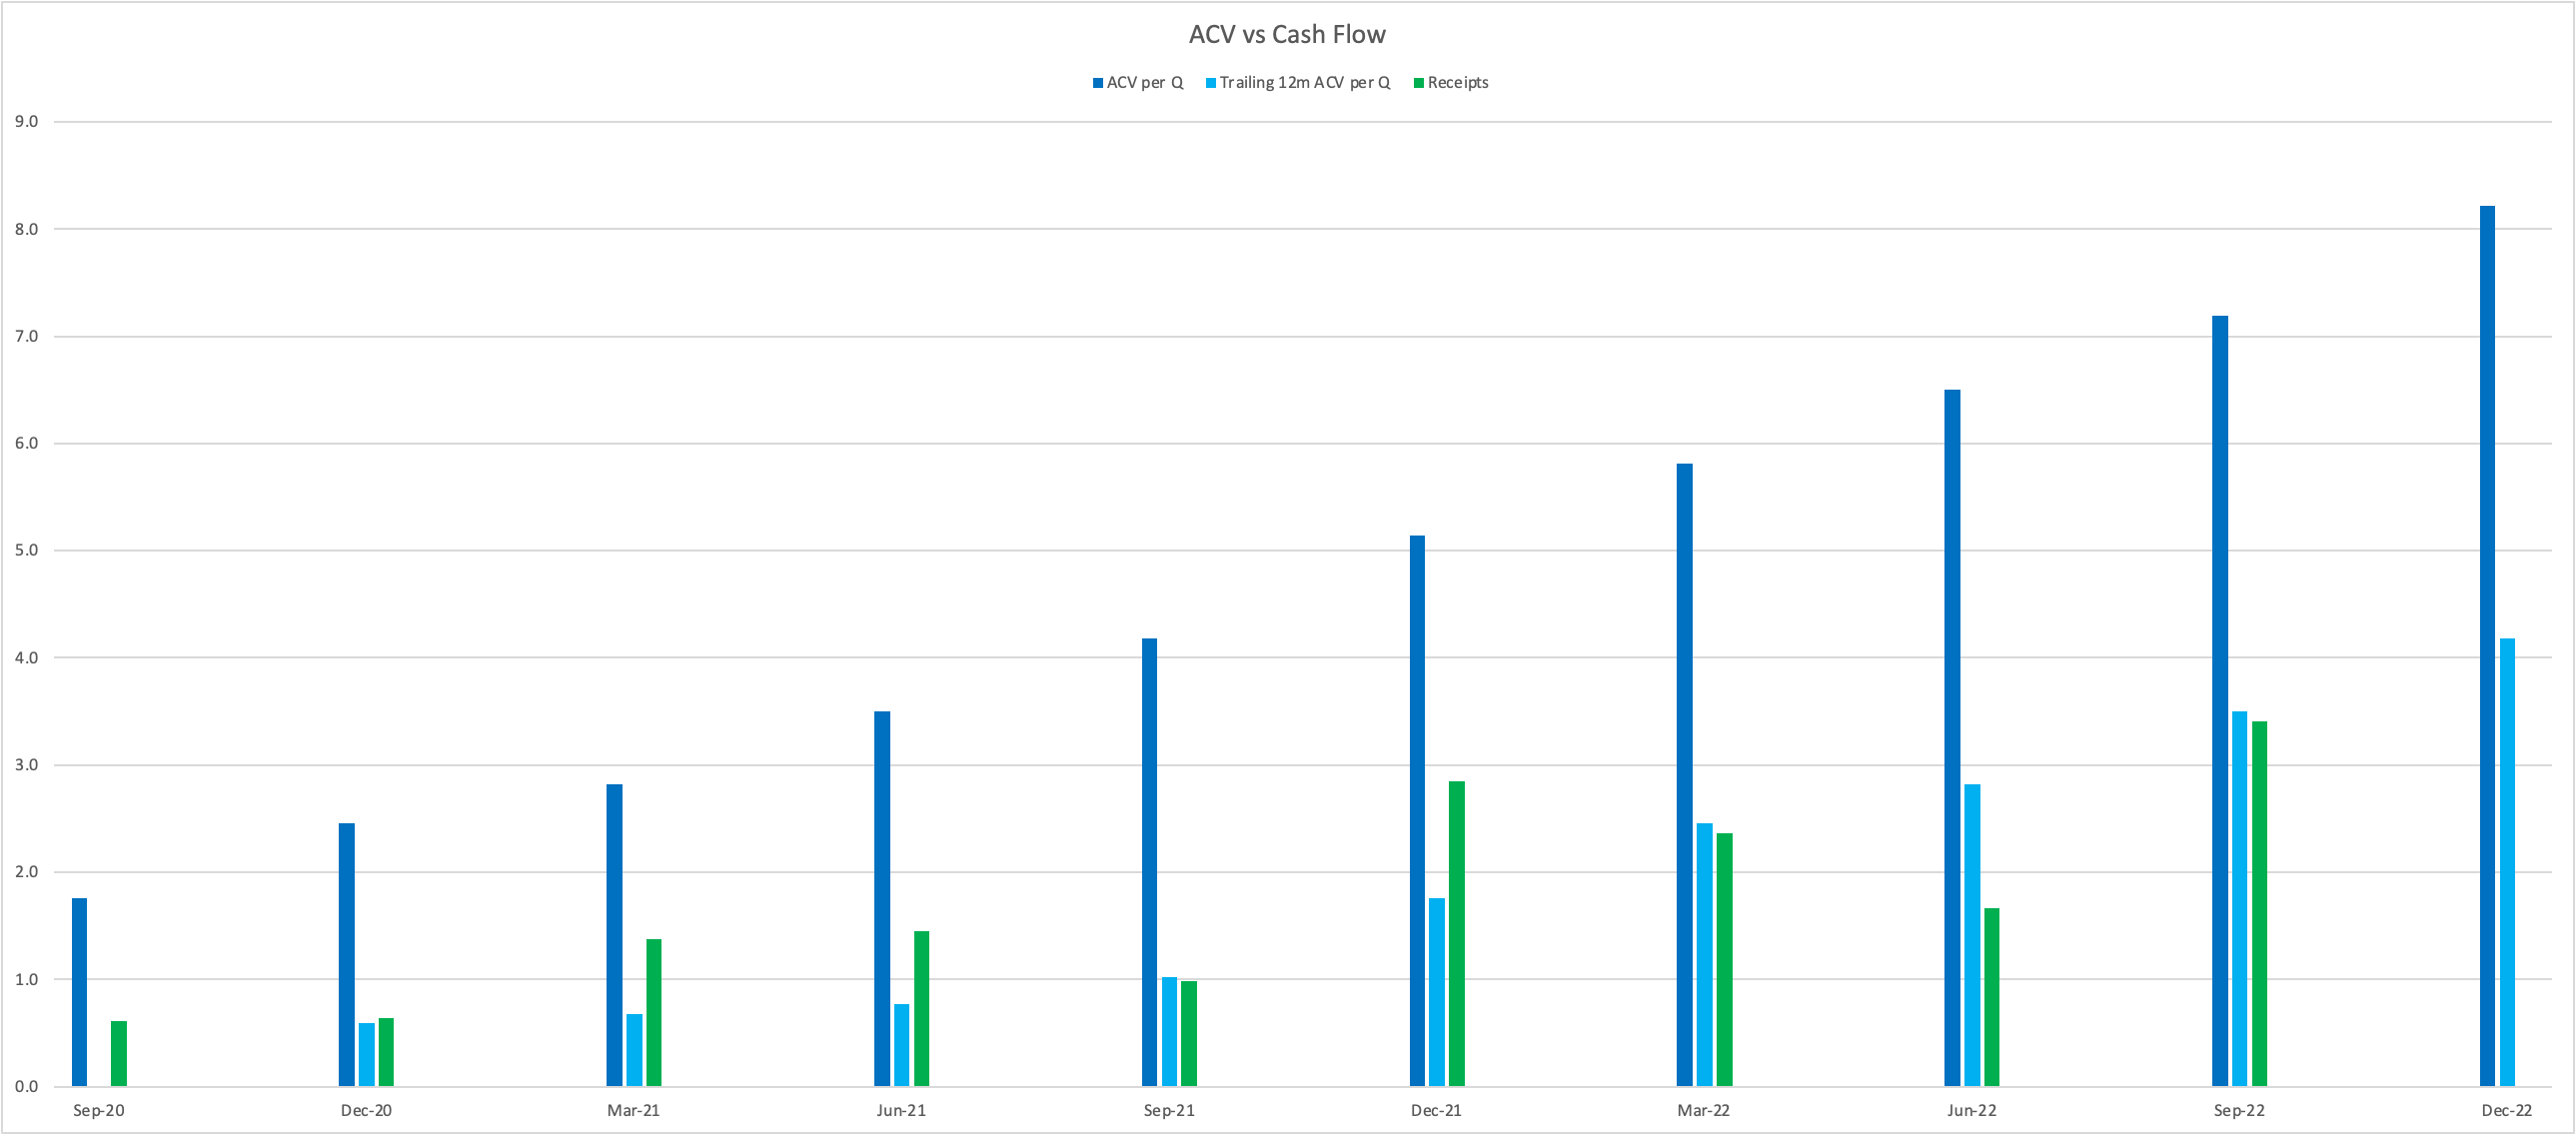
Musings on the already mentioned ACV and Cash receipts.
At Sep22 the light blue bar matches the Dark blue bar from Jun2. Hence Cash Receipts (green bar) is closely resembling the 15m trailing ACV per Q (Light Blue) = Count 5 bars across from one to the other!
If this trend continues, next Q indicates approx. 4.2m in cash receipts; irrespective of additional payments - Storm response?. Interestingly to note that Dec21 Cash receipts were 800k cash flow positive for that Q; wonder if that indicates a lumpy utility payment coming up.
More importantly ... As indicated by the Dark Blue bars - Commencing from Jun21 onwards, Cash receipts will add approx. 700k in aud each Q as a result of the increasing ACV of 2m usd Q on Q. That said I have always wondered if the ACV is padded because of the consistent 2m ACV usd per Q add. But if the cash receipts match the trailing 15m ACV then does the shoe fit???
If 700k is added each Q from here, can Ian spend that much?
PS. ACV in the chart is aud at 0.70 exchange rate


