Further to @Tom73's straw, here are the notes I took at the AGM today.
I won't summarise Chairman Chris Warton's address, which you can read here.
Mike gave up an update presentation which had some usefuly information. I'll focus on two elements:
- FY24 Trading Update
- Update on Strategic Initiatives
Overall, he was his usual matter-of-fact delivery style, although at the start he indicated his delight at the recent share price progression, and clearly sounded more upbeat that the progress they are making is getting recognised.
1. FY24 Trading Update
The Trading Update gave information on the 1st four months of 2024.
The chart below shows how the segmental split of sales has evolved, with two views presented: product segment and customer segment. The shares of workplace, safety and automotive segments have all increased slightly at the expense of industrial. On the right of the chart, Mike noted that declining share of Retail and Trade and Other (“small end of town”) customer segements is consistent with the overall trend they are seeing in other businesses.

In the next slide below from Mike’s presentation, it is titled “Highlights - year in review” but it has some relevant current year insights, which I will explain below.

Mike noted that on sales revenue in 1H FY24 vs FY23, they achieved 15% EBITDA “received on additional sales” – this is a key metric Mike has referred to in the FY23 results and, also, I think in his Strawman meeting. Given their statutory EBITDA Margin in FY23 was 4.8%, this would indicate that operating leverage is coming through as Mike has indicated it would. Should this trend continue, it will drive ongoing margin expansion over time. And Mike discussed this in terms of their target to achieve 8% in FY25, and also its significance in terms of their target range of achieving 10%-15% EBITDA margin on all incremental sales into the future. Good to see the evidence showing through.
On scale benefits, Mike described how the centralised purchasing office is achieving scale benefits. This is achieving a 2% to 4% uplift in margin, equating to $1.3m NET, with most of the benefits starting to flow in January / February.
Of the 8 new contracts signed last year with customers, 2 will start in March and 1 in May, with pre-determined order values with purchase orders supplied. One is for $6m for a supply over a two-year period. Mike said “We’re getting invited for big tenders, we’re winning those big tenders. And the investment we’ve made in technology has allowed us to onboard large customers now that we have an EDI linkage … which means that every order they supply to us comes automated instead of via email or via phone and then we manually have to key that in.” So, he said this is driving the people efficiency metrics, which I’ll show below, 2 slides down.
The trading update is shown in the next slide.

Against the 1H revenue target range of $55-$59m, they are at $39.0m after 4 months.
So, by my maths that's 68.4% of the mid-range with 67% of the time elapsed. (But I have no idea what the seasonality is towards the year end, so I can't read anything into that.)
Looking back at the same time last year, their 4 month result of $36.0m ended up being 68.7% of their 1H FY23 result of $52.4m. So they are pretty consistent.
The $39.0m represents +8.3% over the PCP.
So, overall, they appear on track for revenue to be within the 1H guidance range.
On costs, Mike spoke about some of the wage inflation challenges and said “our costs have increased roughly 7.4% since 1st July.” The are clawing this back in the "pricing reset program", mentioned at the FY23 results, however they are only 17% of the way through this, so there is still margin “uptake” still to come. Mike said “we are receiving more gross profit per order and that will obviously benefit us as well when our results come out.”
Mike noted that 1H represents about 42% to 45% of the FY result so, from his perspective, he considers that they are “sitting ahead of plan, which is encouraging.”
Mike then showed the comparable per day metrics over the 1st 4 months FY24 compared with FY23, slide shown below.

I note the daily sales are higher than I calculated in the pcp comparison in my analysis above. Overall, these metrics are encouraging.
I haven’t tried to calculate the potential EPS – slightly tricky with the FY23 result coming off a small base. But they should be making decent progress off these operating metrics.
Encouragingly, the overall business progress appears to be holding consistent with the “non-discretionary” banner that both the Chairman and MD tout.
2. Update on Strategic Initiatives
Mike called several strategic initiatives:
Loyalty Rewards Club, which gets rolled out in March. They hired a couple of people with experience doing this elsewhere, and expect it to drive both revenue and profit.
Launch of a Superstore format, coming first with a redesign of the Brisbane facility, and then will be replicated elsewhere. They are getting support in merchandising and fitouts from suppliers, so not having to bear the full cost. Four other locations have been identified for refurbishment and fit out.
Consolidating Skipper Transport into Heatleys to create a new category format of “Safety, Industrial, Automotive”, something Mike says he saw in the US, and where he perceives there to be a gap in the Australian market. By December the two current ERPs will be integrated onto one system – “quite a significant investment that we’ve made”.
Launch of a Hire Business operation, already operating in Queensland, but to be rolled out across the network focused on the “smaller end of town”. It covers tool, equipment, and lighting, and has alongside it the sale of all the consumables, PPE etc. that are needs for any hired equipment operation. Mike spoke about the attractive metrics, with payback on investment in the first 13 weeks, whereafter revenue drops straight to 100% gross profit, and then items are sold after a further period to recover value.
My Overall Takeaways
Good progress showing through on a range of metrics and very consistent where Mike indicated the business would be heading at FY results and at the SM meeting.
I have only a small position, which I am minded to increase, but will wait to see if there are opportunities to do better than today's SP.
Disc. Held in RL and SM
As mentioned yesterday, @Strawman's and @DrPete's enthusiasm for $SGI spurred me into a deep dive into the numbers of the business. In this straw I outline the potential earnings and cash flow leverage the business has to modest organic growth and margin improvement. It’s not a valuation, as such, but more like a sensitivity analysis that indicates the very material upside potential of the business.
After reviewing the SM meeting recordings and recent company presentations, some key facts stand out:
- Revenue has grown steadily at a c. 15% CAGR over the last 4 years through a mix of organic and inorganic growth;
- Consistently profitable at Statutory NPAT level;
- Broadly cash neutral over 2019-2022, with 2023 a breakout with FCF of >$5m (although partly due to a higher than normal level of payables);
- Lean IT-system investments enabling adoption of best practice inventory management and (in future) dynamic price management; and
- Capital light model as majority of stores are partner-owned-and-operated.
However, what stood out most of all (and in fact really piqued my attention) was CEO Mike Arnold's assertion that their existing partners purchase some $60m of sales from the top 5 current $SGI suppliers but currently outside of the $SGI umbrella.
In valuing any business, I try to understand the quality of the organic revenue engine - particularly that which is accessible without significant new investments. So, I present below a set of scenarios out to 2027, to estimate the 2027 earnings, calculate value/share based on p/e ratios of 8, 12 and 16, and then discount these at 11%p.a. back to today to get some sense of the current value.
While about it, I consider a larger set of scenarios as follows, with further comments below on why I have chosen these:
- Annual revenue growth of 8%, 10% and 12% FY23 out to FY27
- %GM at 30% in F24 increasing progressively to 31% by 2027 (and 31.5% in the 12% revenue growth scenario)
- % Cost of Doing Business starting at 24% and falling progressively to 23% in FY27 (22% in the 12% revenue growth scenario)
Comments on values selected:
- Revenue: even in the highest 12% p.a. growth, this only takes 2027 revenue to $175m, so the lion's share of revenue growth could potentially be achieved by progressively capturing more of the potential partner volume from existing top 5 suppliers. This is an organic scenario and doesn't assume any network expansion.
- Gross Margin: with increasing volumes, better deals will be struck with suppliers. In addition, Mike has said they are going to add higher margin (albeit lower value) white label lines. Finally, the benefit of recent price increases initiated part way during FY23 are yet to show through, albeit they will be eroded by price and cost increases. So, the %GM margins are modest, and might even be improved upon. The table below shows the %GM in FY24 ("%GMi") and this improves incrementally and linearly to achieve with "%GMf" in FY27.
- Cost of Doing Business (CoDB): this assumes good cost control and it picks up on Mike's target that they can get from 24% to 19% over time, and that now incremental volumes are attracting a <10% incremenal CoDB. So, again, the range of scenarios is modest. The table below shows CoDB/Revenue(%) starting at "CoDBi" in FY24 (which is 24%) and reducing progressively and linearly each year to reach "CoDBf" in FY27. I assume there is greater leverage potential in the high revenue growth assumption.
I assume receivables, payables and inventory all scale with revenue (actually they should scale more slowly for a given network), and that other P&L, cashflow and balance sheet items scale with increasing Cost of Doing Business. However, I do assume a significant ongoing investment in systems, with FY24 (PPE+Intangibles) of $6.2m and scaling annually with CoDB. Mike will need to continue to make prudent systems investments to maintain an efficient, scalable operation.
With long term debt falling to zero, I assume the financing continues to be a revolving facility to fund progressively increasing inventory - the major balance sheet item. Interest rate of 7% is charged on Leases and Short-Term Financing.
I don't model any accumulation of free cash, so as far as the model is concerned all free cash is paid out and does not earn interest, but I have not tested this against the potential payout goal to achieve 5% yield, although the FY27 FCF looks pretty healthy and is lower than you might expect because I have a fair chunk going into Intangibles (IT Systems).
In essence, therefore, the modelling indicates the earnings and free-cashflow leverage over the next 4 years as $SGI passes through its inflection point.
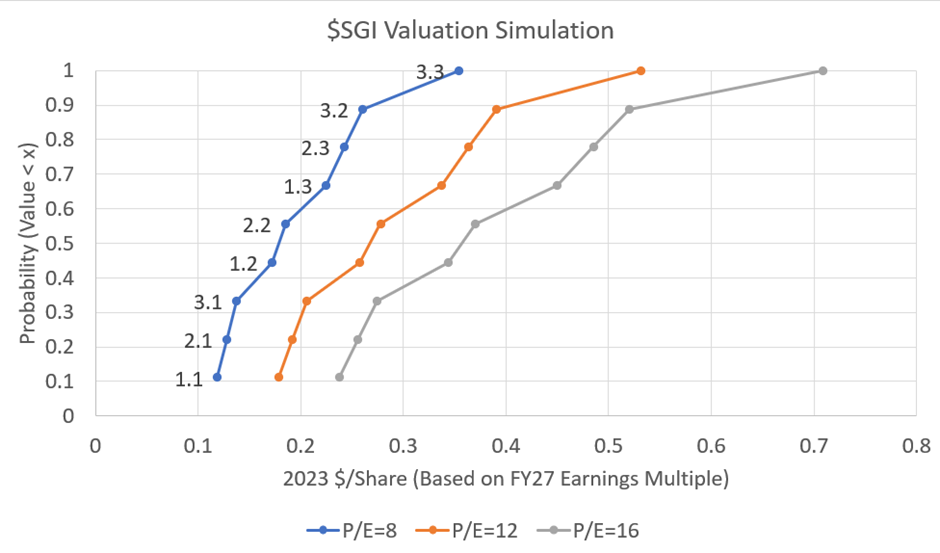
Model inputs and results are presented in Table 1. I've then plotted the calculated $/share in three curves in Figure 1. Each curve lists the 9 scenario results for each P/E ratio. Assuming each scenario has an equal likelihood, results are plotted as an implied probability function.
TABLE 1: Scenario Inputs and Summary Results
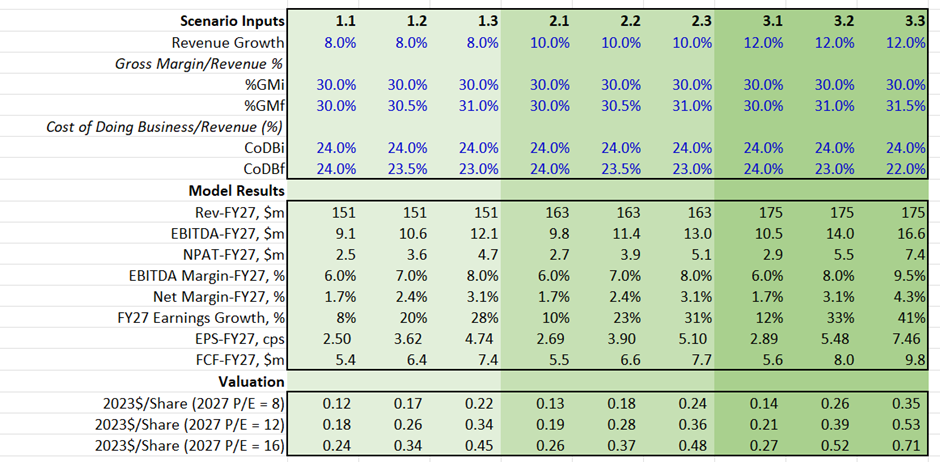
To get your eye in on the graph below, the three results, 1.1, 2.1, and 3.1, show the effect of revenue growth and P/E expansion only, without any margin improvements.
FIGURE 1: Modelled Valuations for Each Scenario at a Range of Assumed P/Es
(Note: labels on blue line relate to scenario number; labels read across horizontally for orange and grey P/E curves)
Discussion of Results
First, I am not pretending to have properly modelled the value of $SGI. For sure, I have no doubt that Mike will continue to pursue both organic and inorganic growth, with the prospect that over the next 4 years revenue growth will be higher than I have considered. After all, the current target is to get to $200m revenue by FY25! (Good luck) Because of that, I don't think margins and cost of doing business will advance in the smooth way that I have assumed. If $SGI try to acquire their way to their targets, CoDB will likely go backwards before it improves.
However, I still believe the analysis is instructive because it confirms the following:
- Material growth in value does not rely on driving revenue to achieve the FY25 "target"
- There is a lot of leverage to modest improvements in margins and control of costs
- Investments in technology to continue to support business scalability can yield significat returns, particularly if $SGI can continue to achieve a lean off-the-shelf approach to adoption of systems
- The existing partner volumes that currently lie outside the $SGI supply chain are a very valuable prize.
Remember, all of this assumes that most of the growth will come from bringing much of the current $60m of purchases by $SGI’s partners from $SGI’s top 5 suppliers that is currently outside $SGI’s scope. Of course just because Mike is targeting this doesn’t mean they’ll get it. For example, perhaps current partners are obtaining these supplies via one of the category-focused market leaders (think workwear and PPE, autoparts etc.). These suppliers may already have a scale that means $SGI cannot offer better value. Time will tell. But this is one reason to consider this analysis a sensitivity analysis and not a valuation or prediction.
Key Takeaway
While my methodology and assumptions are very different to @DrPete's, the conclusion is the same. If $SGI continues to be well-managed driving a balanced approach to revenue growth, returns and operational efficiency, there is a very significant multi-bagger upside.
Risks? Of course there are several. Industrial MRO is a mature market and although $SGI highlight the huge market scale, there are existing players with 10-20x SGI's scale, including category specialists. It is easy to code incremental margin improvements in a spreadsheet, but not so easy to do deliver margin improvements in practice in such a market.
Moves by competitors to grow or defend share or existing partners defecting from the "$SGI consortium" cannot be ruled out. In fact, this potentially becomes more likely as $SGI continues to scale and improve its own margins. In my sensitivity analysis these downsides are not considered. So beware.
As ever, anything but the most modest of acquisitions would also be likely to muddy the waters, even if it expands the network and volumes which will ultimately deliver returns if $SGI continues to execute well.
So What? After All This Analysis!
If pushed, I’d venture that $SGI is fairly worth anywhere between $0.20 and $0.30 today. Over time, however, if it sustains a strong earnings growth trajectory, there is significant further upside if it re-rates to achieve growth stock P/E ratios. (A good comparator case study would be $SNL.)
So, I have voted up @Strawman 's valuation of $0.23 from 4 months ago.
-------------------------------------------------------------------------------
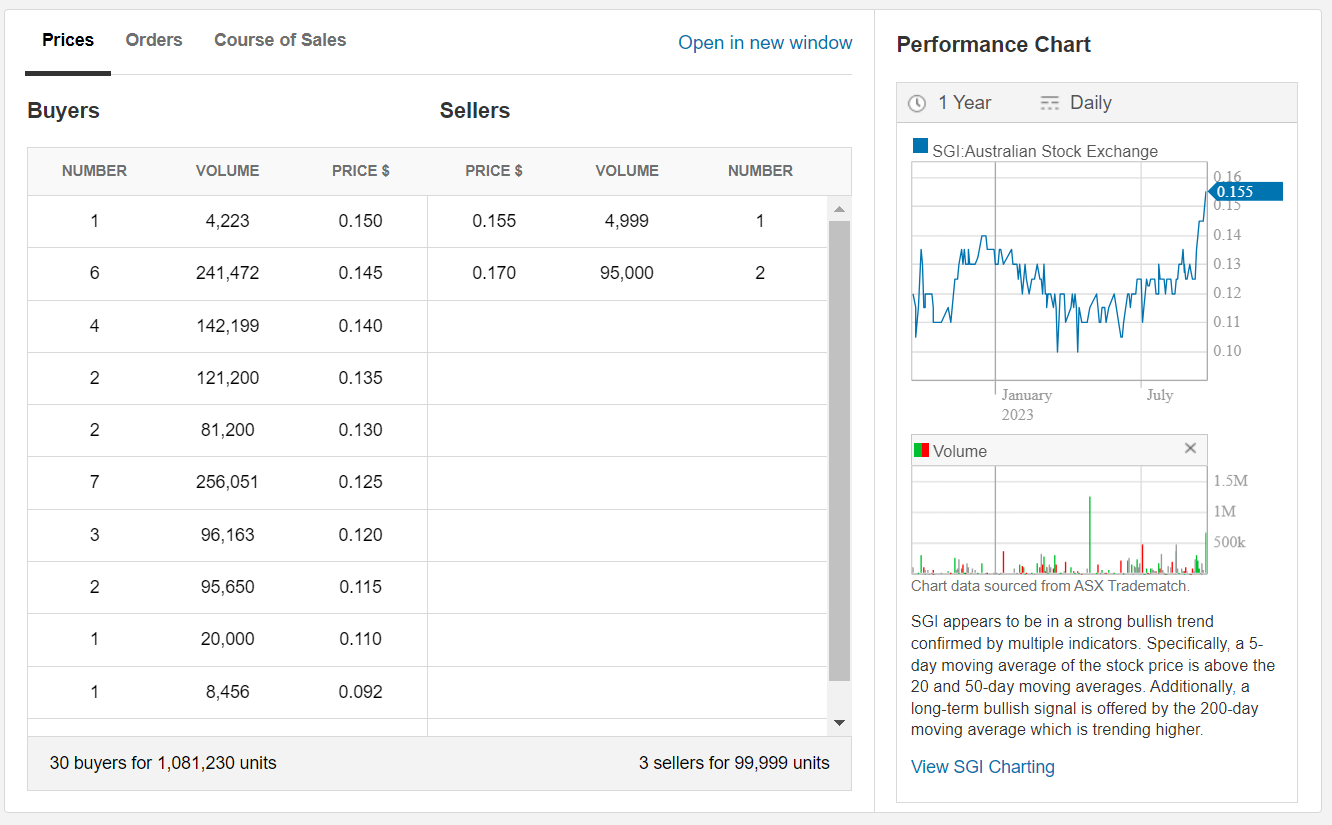
P.S. This morning, I pushed my order up to $0.155, and it cleared. Now looking a wee bit thin on the sell side!